RSS

The trend in housing starts was 214,621 units in May 2017, compared to 213,435 units in April 2017, according to Canada Mortgage and Housing Corporation (CMHC). This trend measure is a six-month moving average of the monthly seasonally adjusted annual rates (SAAR) of housing starts.


“Housing starts trended higher in May in Canada’s urban areas”, said Bob Dugan, CMHC’s Chief Economist. “Row and apartment units led the upward move, while construction has slowed for pricier single- and semi-detached houses.”

Monthly highlights

Halifax

Apartment construction continues to drive the residential market in Halifax with year-to-date apartment starts more than double 2016 levels. The single-detached demand is also picking up pace following a couple years of decline. Year-to date, single-detached construction has grown by 16 percent.

Québec

For the Québec area, the gradual decrease in the rate of housing starts which started at the beginning of the year continued in May. Condominium construction remains below the average of recent years and activity in the conventional rental housing segment also seems to be adjusting downward. This decline is occurring in a context where the vacancy rate is on the rise, particularly for newly built projects.

Toronto

In Toronto, total starts trended lower largely as a result of a decrease in single-detached and row units. May marks the first month that single-detached starts have bucked their upward trend since September 2016. This coincides with a noticeable increase in new home listings in the resale market, providing added choice to homebuyers, causing less demand to spill over into the new home market.

Kitchener-Cambridge-Waterloo

The trend of housing starts in Kitchener-Cambridge-Waterloo (KCW) increased in May due to stronger starts for all types of housing. Single-detached and townhouse starts are higher this year. Demand for these housing types has been strong in the past few months due to the tight resale market and the influx of GTA households looking to purchase a more affordable home. New single-detached prices in KCW are approximately half of the cost of the same type of dwelling in Toronto.

Alberta & Saskatchewan

Housing starts are on the rise this year in most centres in Alberta and Saskatchewan – a good indication these oil and gas-dependent provinces are on the road to recovery. Strengthening labour market conditions in Calgary, Edmonton and Regina have generated more optimism among local homebuilders. In Saskatoon, year-to-date starts declined 25% as builders there remain cautious due to elevated multi-unit inventory.

British Columbia

Housing starts in BC trended higher in May with gains in Kelowna, Abbotsford-Mission and other urban areas off-setting a slower pace in Vancouver and Victoria. Low inventory in both the resale and new home market is fueling new construction with single-detached and multi-family starts leading the way.

Vancouver

Despite a slight downward move in May, overall housing starts for Vancouver are on track to exceed 25,000 new homes this year, nearing the record 27,914 starts set in 2016. The decline from April was almost evenly split between a slowdown in starts of ownership apartments (condos) and rental apartments.


CMHC uses the trend measure as a complement to the monthly SAAR of housing starts to account for considerable swings in monthly estimates and obtain a more complete picture of Canada’s housing market. In some situations analyzing only SAAR data can be misleading, as they are largely driven by the multi-unit segment of the market which can vary significantly from one month to the next.


The standalone monthly SAAR of housing starts for all areas in Canada was 194,663 units in May, down from 213,498 units in April. The SAAR of urban starts decreased by 10.2 per cent in May to 178,518 units.


Multiple urban starts decreased by 10.8 per cent to 118,694 units in May and single-detached urban starts decreased by 8.9 per cent, to 59,824 units.


Rural starts were estimated at a seasonally adjusted annual rate of 16,145 units.


Preliminary Housing Starts data are also available in English and French through our website and through CMHC’s Housing Market Information Portal. Our analysts are also available to provide further insight into their respective markets.


As Canada’s authority on housing, CMHC contributes to the stability of the housing market and financial system, provides support for Canadians in housing need, and offers objective housing research and information to Canadian governments, consumers and the housing industry.


Read

Canada Mortgage and Housing Corporation (CMHC) released today its annual Mortgage Consumer Survey. The largest survey of its kind, the Mortgage Consumer Survey provides insights into the behaviours, attitudes and expectations of Canadians when acquiring, renewing or refinancing a mortgage.


“Relationships and referrals are a very important part of the mortgage lending industry” said Nathalie Fredette, Vice-President, Client Relationship Management. “The Survey findings can be used by mortgage professionals to manage their businesses by improving the overall customer experience.”

Mortgage insurance parameter changes

  • Just over half of buyers were aware of the latest mortgage qualification changes.
  • About one-in-five noted that the latest mortgage qualification changes impacted their purchase decision. 

First time buyers receiving down payment support

  • 18% of first time buyers received a gift from a family member as part of their down payment.
  • First time buyers who received a gift from family as part of their down payment were less comfortable with their current level of mortgage debt, were less likely to have other assets to supplement their needs, and were less confident about knowing where to turn in the event that they run into financial trouble.

Emerging use of technology

  • Almost half of mortgage consumers agree they would feel comfortable using more technology to arrange their next mortgage transaction.
  • Four in ten mortgage consumers noted they would be comfortable arranging their entire mortgage transaction using secure online tools and apps, without having to meet their mortgage professional in person. That being said, the majority of mortgage consumers agree that it is still important to meet face to face with their mortgage professional when negotiating (69%) and finalizing (70%) their mortgage.

Additional survey findings are available here.


CMHC helps Canadians meet their housing needs. As Canada’s authority on housing, we contribute to the stability of the housing market and financial system, provide support for Canadians in housing need, and offer objective housing research and advice to Canadian governments, consumers and the housing industry. Prudent risk management, strong corporate governance and transparency are cornerstones of our operations.

Read

With Toronto’s housing market showing signs of cooling, and Vancouver’s days of heady price increases now well behind it, a new top dog is emerging in Canada’s real estate market: Montreal.


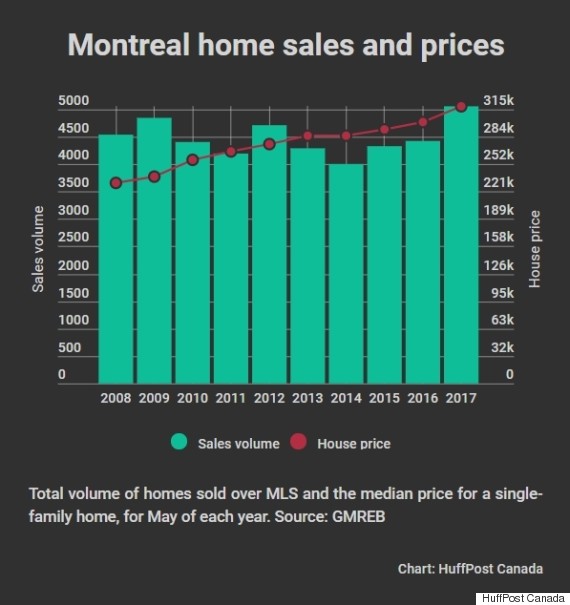
The city posted record-high sales in May, jumping 15 per cent from the same month a year ago, according to data released Tuesday by the Greater Montreal Real Estate Board. That's the highest volume the city has seen since before the financial crisis of 2008-9.


“This was an exceptional month of May on Montreal’s residential real estate market,” Mathieu Cousineau, president of the GMREB Board of Directors, said in a statement.


Single-family home prices have risen six per cent in the past year. While that sounds like peanuts compared to the double-digit price growth seen recently in Toronto, it’s quite a change for Montreal, whose housing market had been treading water for several years.

montreal

As recently as January, the city’s real estate board was predicting 1-per-cent price growth for the coming year. It now expects a 6-per-cent pace.


After the Ontario government introduced a 15-per-cent foreign buyers’ tax for the Greater Toronto Area, many observers started wondering if Montreal, long left out of Canada’s real estate frenzy, would be the next target for foreign buyers.


The city had already been attracting wealthy migrants from Europe, particularly France, which has been experiencing an exodus of millionaires.


But so far, there’s little evidence of a rush of Asian investors seeking to avoid the foreign buyer taxes in Toronto and Vancouver.

montreal home sales and prices

Montreal saw “a bit more” Asian investors following Vancouver’s introduction of the tax last year, CMHC Montreal analyst David L’Heureux told Bloomberg last week.


But “at the moment I don’t think it has a significant impact on demand,” he said.


Whether or not that changes with Toronto’s foreign buyer tax, introduced in April, remains to be seen.


In the meantime, strong job growth and increasing migrant numbers are behind Montreal's accelerating market, Paul Cardinal of the Quebec Federation of Real Estate Boards said in a report last month.


All the same, Montreal remains considerably more affordable than Toronto or Vancouver. The median price of a single-family home rose to $319,000 in May, a fraction of the $1.1-million average price recorded last month in Toronto, and the $1.56-million benchmark price in Vancouver.


Provided By: Daniel Tencer with the Huffington Post

Read

Home buyer activity returned to near record levels across the Metro Vancouver* housing market in May.


Residential property sales in the region totalled 4,364 in May 2017, a decrease of 8.5 per cent from the 4,769 sales in May 2016, an all-time record, and an increase of 22.8 per cent compared to April 2017 when 3,553 homes sold.


Last month’s sales were 23.7 per cent above the 10-year May sales average and is the thirdhighest selling May on record. 


"Demand for condominiums and townhomes is driving today’s activity," Jill Oudil, Real Estate Board of Greater Vancouver (REBGV) president said. “First-time buyers and people looking to downsize from their single-family homes are both competing for these two types of housing.” 


New listings for detached, attached and apartment properties in Metro Vancouver totalled 6,044 in May 2017. This represents a 3.9 per cent decrease compared to the 6,289 units listed in May 2016 and a 23.2 per cent increase compared to April 2017 when 4,907 homes were listed. 


The month-over-month increase in new listings was led by detached homes at 27.1 per cent, followed by apartments at 22.7 per cent and townhomes at 14.1 per cent. 


The total number of properties currently listed for sale on the MLS® system in Metro Vancouver is 8,168, a 5.7 per cent increase compared to May 2016 (7,726) and a 4.5 per cent increase compared to April 2017 (7,813). 


"Home buyers are beginning to have more selection to choose from in the detached market, but the number of condominiums for sale continues to decline," Oudil said.


The sales-to-active listings ratio across all residential categories is 53.4 per cent. By property type, the ratio is 31 per cent for detached homes, 76.1 per cent for townhomes, and 94.6 per cent for condominiums. 


Generally, analysts say that downward pressure on home prices occurs when the ratio dips below the 12 per cent mark for a sustained period, while home prices often experience upward pressure when it surpasses 20 per cent over several months. 


“While sales are inching closer to the record-breaking pace of 2016, the market itself looks different. Sales last year were driven by demand for single-family homes. This year, it's clear that townhomes and condominiums are leading the way,” said Oudil. “It’s important to work  with your local REALTOR® to understand the different factors affecting the market today.”


The MLS® Home Price Index composite benchmark price for all residential properties in Metro Vancouver is currently $967,500. This represents an 8.8 per cent increase over May 2016 and a 2.8 per cent increase compared to April 2017.


Sales of detached properties in May 2017 reached 1,548, a decrease of 17 per cent from the 1,865 detached sales recorded in May 2016. The benchmark price for a detached property is $1,561,000. This represents a 3.1 per cent increase over May 2016 and a 2.9 per cent increase compared to April 2017.


Sales of apartment properties reached 2,025 in May 2017, a decrease of 5.8 per cent compared to the 2,150 sales in May 2016.The benchmark price for an apartment property is $571,300. This represents a 17.8 per cent increase over May 2016 and a 3.1 per cent increase compared to April 2017.


Attached property sales in May 2017 totalled 791, an increase of 4.9 per cent compared to the 754 sales in May 2016. The benchmark price for an attached property is $715,400. This represents a 13.1 per cent increase over May 2016 and a 1.9 per cent increase compared to April 2017.


*Editor’s Note: Areas covered by the Real Estate Board of Greater Vancouver include: Whistler, Sunshine Coast, Squamish, West Vancouver, North Vancouver, Vancouver, Burnaby, New Westminster, Richmond, Port Moody, Port Coquitlam, Coquitlam, Pitt Meadows, Maple Ridge, and South Delta.


The real estate industry is a key economic driver in British Columbia. In 2016, 39,943 homes changed ownership in the Board’s area, generating $2.5 billion in economic spin-off activity and an estimated 17,600 jobs. The total dollar value of residential sales transacted through the MLS® system in Greater Vancouver totalled $40 billion in 2016. The Real Estate Board of Greater Vancouver is an association representing more than 13,500 REALTORS® and their companies. The Board provides a variety of member services, including the Multiple Listing Service®. For more information on real estate, statistics, and buying or selling a home, contact a local REALTOR® or visit www.rebgv.org.


Read
Reciprocity Logo The data relating to real estate on this website comes in part from the MLS® Reciprocity program of either the Greater Vancouver REALTORS® (GVR), the Fraser Valley Real Estate Board (FVREB) or the Chilliwack and District Real Estate Board (CADREB). Real estate listings held by participating real estate firms are marked with the MLS® logo and detailed information about the listing includes the name of the listing agent. This representation is based in whole or part on data generated by either the GVR, the FVREB or the CADREB which assumes no responsibility for its accuracy. The materials contained on this page may not be reproduced without the express written consent of either the GVR, the FVREB or the CADREB.