Home buyers and sellers were less active in Metro Vancouver* throughout the first quarter of 2018. The Real Estate Board of Greater Vancouver (REBGV) reports that residential home sales in the region totalled 2,517 in March 2018, a 29.7 per cent decrease from the 3,579 sales recorded in March 2017, and a 14 per cent increase compared to February 2018 when 2,207 homes sold.
Last month’s sales were 23 per cent below the 10-year March sales average. There were 6,542 home sales on the Multiple Listing Service® (MLS®) in Metro Vancouver during the first quarter of 2018, a 13.1 per cent decrease from the 7,527 sales over the same period last year. This represents the region’s lowest first-quarter sales total since 2013.
“We saw less demand from buyers and fewer homes listed for sale in our region in the first quarter of the year,” Phil Moore, REBGV president said. “High prices, new tax announcements, rising interest rates, and stricter mortgage requirements are among the factors affecting home buyer and seller activity today.
There were 4,450 detached, attached and apartment properties newly listed for sale in Metro Vancouver in March 2018. This represents a 6.6 per cent decrease compared to the 4,762 homes listed in March 2017 and a 5.4 per cent increase compared to February 2018 when 4,223 homes were listed.
There were 12,469 homes listed for sale in Metro Vancouver during the first quarter of 2018, a 0.8 per cent decrease from the 12,568 sales over the same period last year. This represents the region’s lowest first-quarter new listings total since 2013.
The total number of homes currently listed for sale on the MLS® system in Metro Vancouver is 8,380, a 10.5 per cent increase compared to March 2017 (7,586) and a 7.1 per cent increase compared to February 2018 (7,822).
“Even with lower demand, upward pressure on prices will continue as long as the supply of homes for sale remains low,” Moore said. “Last month was the quietest March for new home listings since 2009 and the total inventory, particularly in the condo and townhome segments, of homes for sale remains well below historical norms.”
For all property types, the sales-to-active listings ratio for March 2018 is 30 per cent. By property type, the ratio is 14.2 per cent for detached homes, 39.9 per cent for townhomes, and 61.6 per cent for condominiums. Generally, analysts say that downward pressure on home prices occurs when the ratio dips below the 12 per cent mark for a sustained period, while home prices often experience upward pressure when it surpasses 20 per cent over several months.
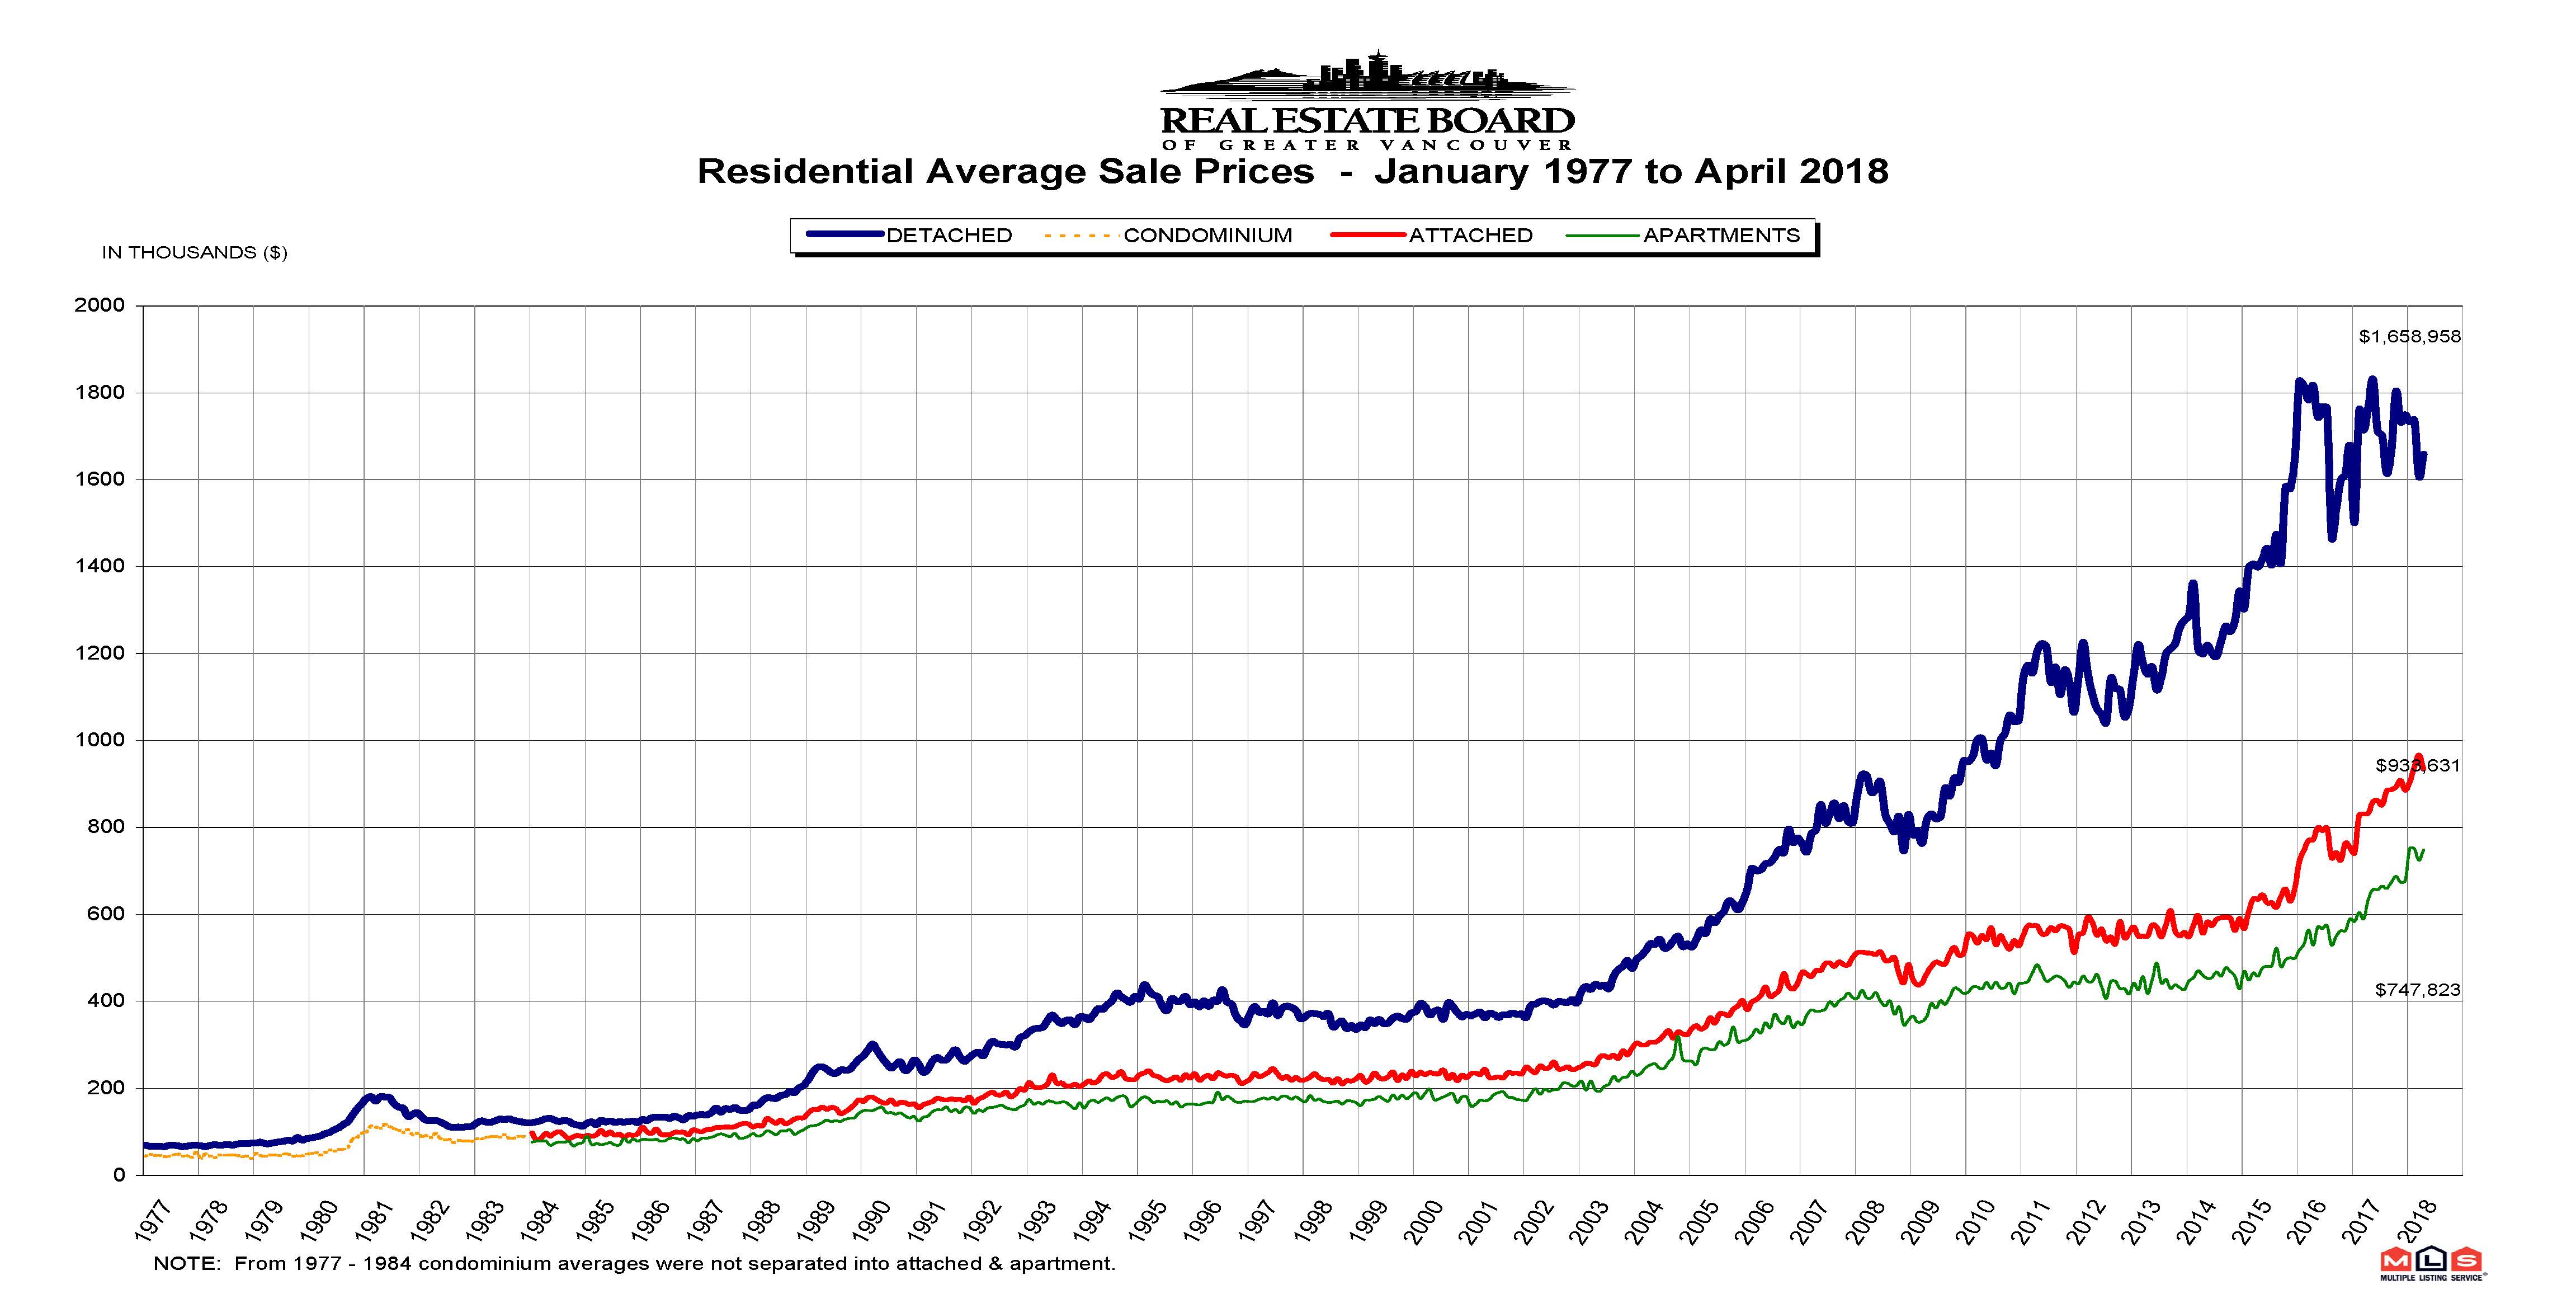
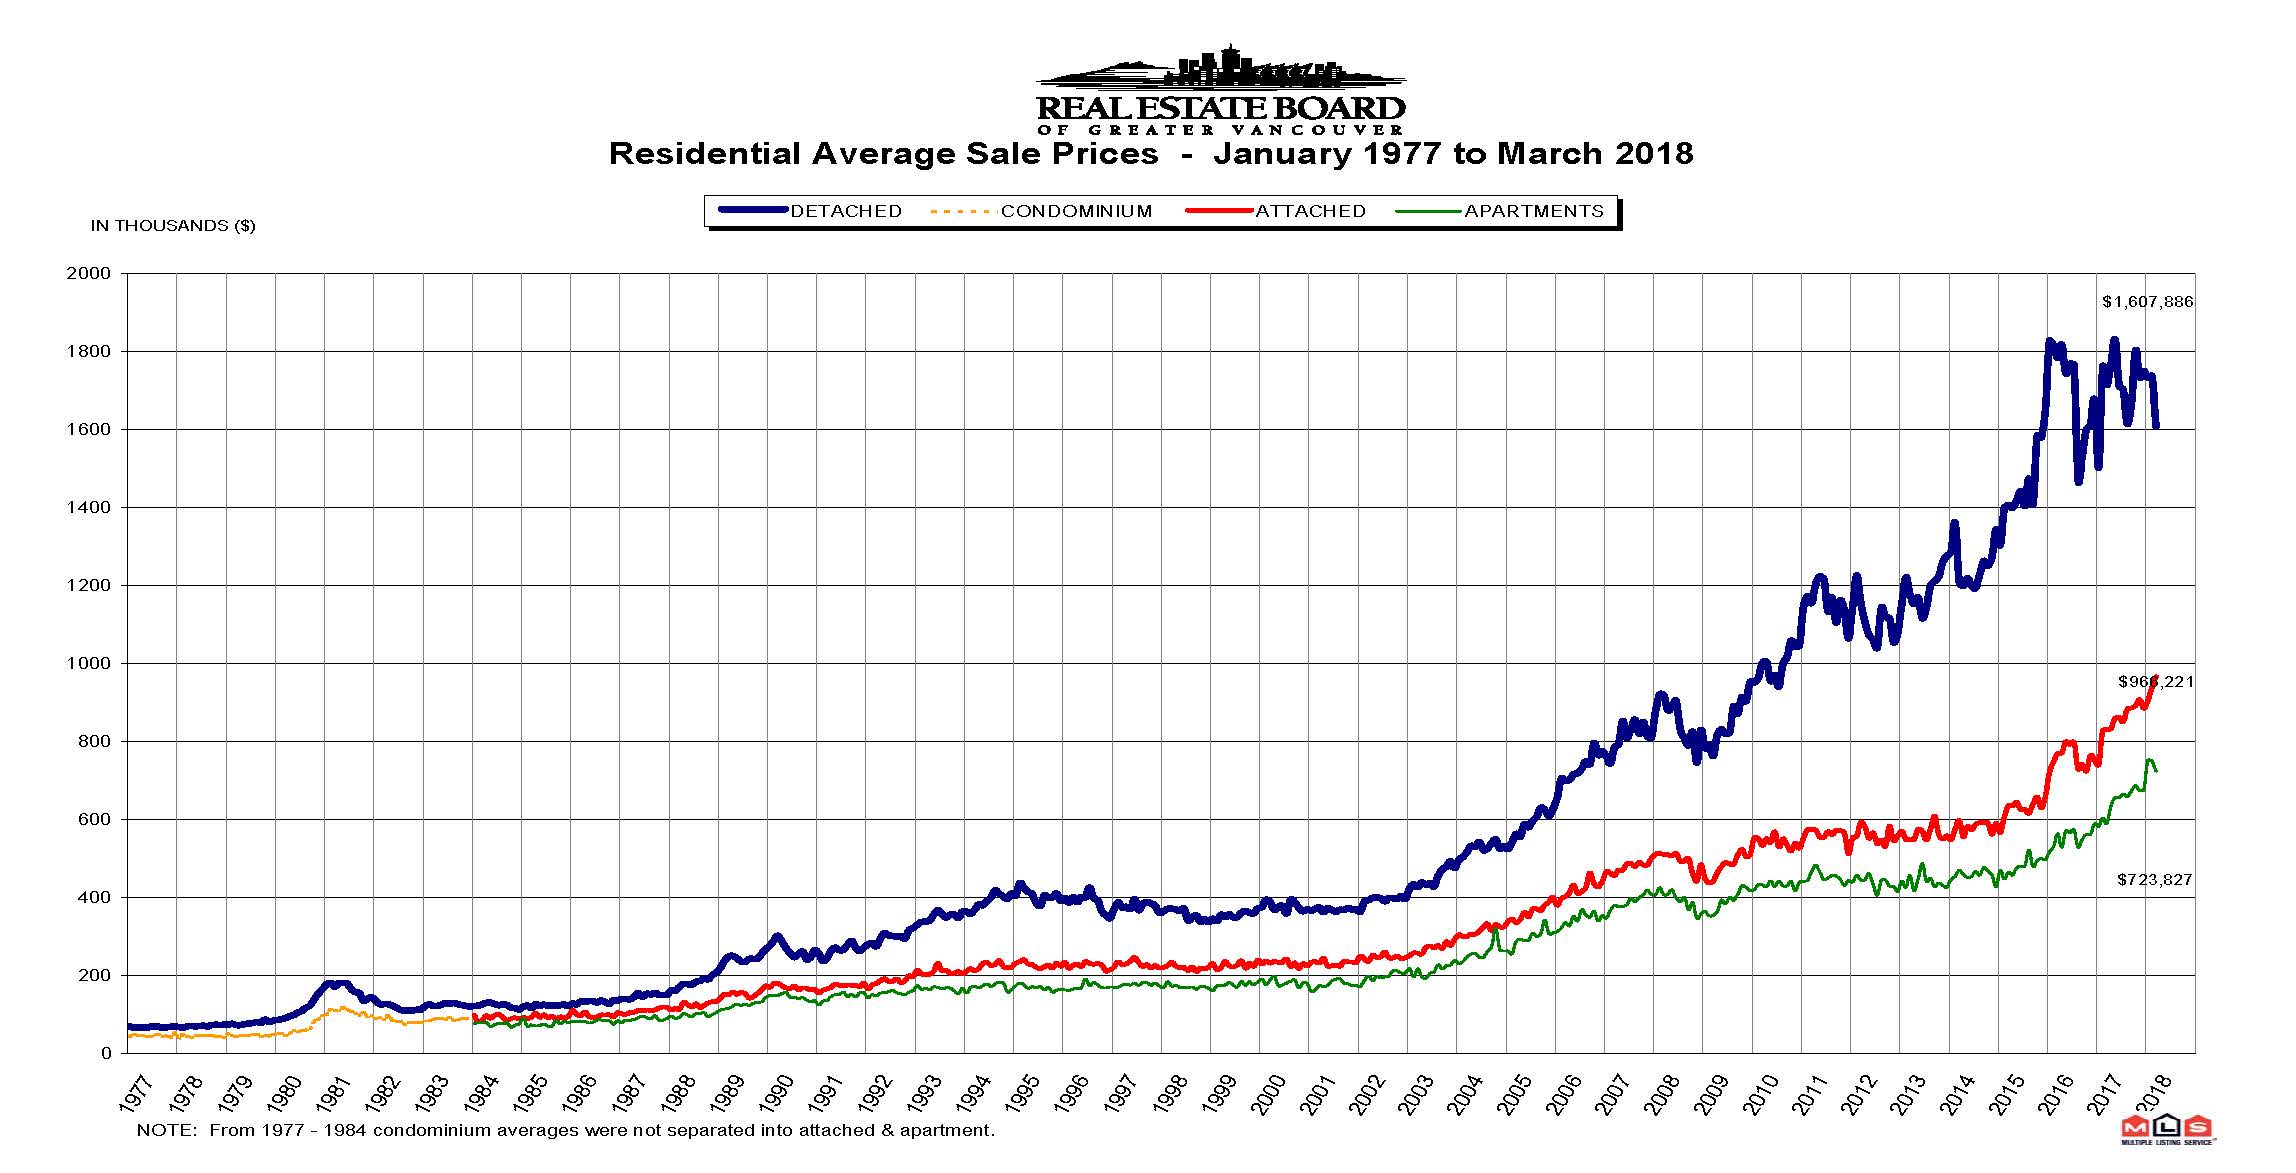
The MLS® Home Price Index composite benchmark price for all residential properties in Metro Vancouver is currently $1,084,000. This represents a 16.1 per cent increase over March 2017 and a 1.1 per cent increase compared to February 2018.
Sales of detached properties in March 2018 reached 722, a decrease of 37 per cent from the 1,150 detached sales recorded in March 2017. The benchmark price for detached properties is $1,608,500. This represents a 7.4 per cent increase from March 2017 and a 0.4 per cent increase compared to February 2018.
Sales of apartment properties reached 1,349 in March 2018, a decrease of 26.7 per cent compared to the 1,841 sales in March 2017. The benchmark price of an apartment property is $693,500. This represents a 26.2 per cent increase from March 2017 and a 1.6 per cent increase compared to February 2018.
Attached property sales in March 2018 totalled 446, a decrease of 24.1 per cent compared to the 588 sales in March 2017. The benchmark price of an attached unit is $835,300. This represents a 17.7 per cent increase from March 2017 and a two per cent increase compared to February 2018.
*Editor’s Note: Areas covered by the Real Estate Board of Greater Vancouver include: Whistler, Sunshine Coast, Squamish, West Vancouver, North Vancouver, Vancouver, Burnaby, New Westminster, Richmond, Port Moody, Port Coquitlam, Coquitlam, Pitt Meadows, Maple Ridge, and South Delta.
The real estate industry is a key economic driver in British Columbia. In 2017, 35,993 homes changed ownership in the Board’s area, generating $2.4 billion in economic spin-off activity and an estimated 17,600 jobs. The total dollar value of residential sales transacted through the MLS® system in Greater Vancouver totalled $37 billion in 2017.
The Real Estate Board of Greater Vancouver is an association representing more than 14,000 REALTORS® and their companies. The Board provides a variety of member services, including the Multiple Listing Service®. For more information on real estate, statistics, and buying or selling a home, contact a local REALTOR® or visit www.rebgv.org.