Lush Forest Backdrop
2 bed & Den Concrete Home
Priced at $634,800

Lush Forest Backdrop
2 bed & Den Concrete Home
Priced at $634,800
An Angus Reid survey has found the majority of people in Metro Vancouver want to see housing prices come down.
A majority of Metro Vancouver residents would welcome a drop in real estate prices in the region, according to a new poll.
The Angus Reid survey, released Monday, found that 62 per cent of those polled wanted to see prices fall. Of that group, 26 per cent wanted prices to fall by about 10 per cent, while 36 per cent wanted a price drop of 30 per cent or more.
According to the survey’s overview, “perhaps the most counter-intuitive finding for outsiders” was the substantial number of residents who would like to see the housing market crash.
“While it is likely not surprising that 86 per cent of renters are hoping for a correction, given that they have no personal stake in appreciating housing values, a significant number of current homeowners feel the same way,” the survey said.
Shachi Kurl, executive director of the Angus Reid Institute, was part of the team that conducted the survey.
“Three-in-ten owners say they would prefer the market fall in value by about ten per cent,” Kurl said.
“More notably, they’re also equally as likely to say they would like to see the market crash by 30 per cent or more as they are to say they would like values to rise.”
The survey suggested that high real estate prices are making Vancouverites experience a feeling of altruism.
“Evidently, the pain felt by their neighbours — and children — is weighing on those who would prefer to lose some of their home equity if it means a better quality of life for others.”
Most respondents blamed speculation for the housing crisis, while 35 per cent believed the crisis was due to Metro Vancouver being seen as a desirable place to live.
The also found that 79 per cent of respondents believed B.C. Premier John Horgan’s 30-point plan to address the housing crisis was the right approach.
The NDP’s speculation tax was supported by 88 per cent of respondents. A significant minority, at 39 per cent, supported an even more radical approach to limit the number of homes a person or corporation could own.
Yet at the same time, there was a sense that nothing could be done to improve the situation.
“What emerges as a result of this study is a sense that there is no end in sight to increasing housing costs,” the survey said.
About half of millennials (aged 18 to 35) – at 53 per cent – said regardless of what policies were implemented, they didn’t expect government to have much of an impact on housing prices. That negativity rose to 69 per cent in the 35 to 64 age group and 76 per cent for those 55 and older.
The survey was also conducted in Toronto and compared the two cities. It found – due to having to use transit and facing a commute of an hour or longer – people in the Greater Toronto Area were “slightly more” miserable than people in Vancouver.
“While few from either metropolitan area say housing prices are benefiting the area collectively, Metro Vancouver residents are significantly more negative about the impact.”
A total of 54 per cent of Metro Vancouver residents said housing prices were “hurting a lot,” compared to 30 per cent in Toronto.
The category of housing prices/affordability/real estate was picked by 65 per cent of people as the top issue in Metro Vancouver, an increase of 10 per cent compared to a 2015 Angus Reid study on housing and transportation. During the same period, transportation/traffic/transit dropped to 33 per cent from 36 per cent while homelessness/poverty increased to 27 per cent from 22 per cent.
The data was collected by Angus Reid Institute in an online survey form May 25 to 29 among a representative sample of 719 adult members of Maru Voice Canada, formerly Angus Reid Forum. Maru Voice Canada is an online market research company that pays people for completing surveys.
The survey’s methodology estimates that the probability sample has a margin of error of plus or minus 3.7 per cent, 19 times out of 20.
Provided by: Kevin Griffin for the Vancouver Sun

Fully, professionally renovated condominium following the current trends in the industry. Beautiful hardwood flooring, new kitchen cabinets with granite counter tops and S/S appliances, new bathroom, designer painting and wall finishing and new lighting and plumbing fixtures. Quiet, south facing location in the building, covered balcony, natural gas fireplace. Spacious closets with organizers and new closet doors. The building was totally redone including a new roof, windows, balconies, rain screened, new carpets, lighting and painting in the hallways. Prime location: close to all shopping, park, entertainment, restaurants, art center and public transportation. Pet friendly. Not a ground floor unit. A great home in a well run complex.
Actual sales (not seasonally adjusted) on Canadian MLS Systems were down 1.3 percent in July 2018 from July last year, says the monthly report from the Canadian Real Estate Association (CREA).
This reflects fewer sales in major urban centres in British Columbia and an offsetting improvement in activity in the GTA.
“This year’s new stress test on mortgage applicants continues to weigh on home sales, but its effect may be starting to fade slightly in Toronto and nearby markets,” says CREA president Barb Sukkau. “The degree to which the stress test continues to sideline home buyers varies depending on location, housing type and price range.”
Improving national home sales activity in recent months obscures significant differences in regional trends for home sales and prices, according to Gregory Klump, CREA’s chief economist.
“Regardless, rising interest rates and this year’s stress test on mortgage applicants will likely prove to be difficult hurdles to overcome for many would-be first time and move-up home buyers, heading into the second half of the year and beyond,” says Klump.
New listings fell 1.2 percent in July, below monthly levels recorded over most of the past eight years. New listings were down in more than half of all local markets, led by Calgary, Edmonton and Greater Vancouver (GVA). Fewer new listings in these markets more than offset an increase in new supply in the GTA.
In the 15 housing markets tracked by CREA, eight recorded price increases from a year ago, with little changed in two markets and down in the remainder.
On the Prairies, benchmark home prices remained down on a year-over-year basis in Calgary (-1.7 percent), Edmonton (-1.3 percent), Regina (-4.8 percent) and Saskatoon (-2.1 percent).
Provided by: Myke Thomas for the Province
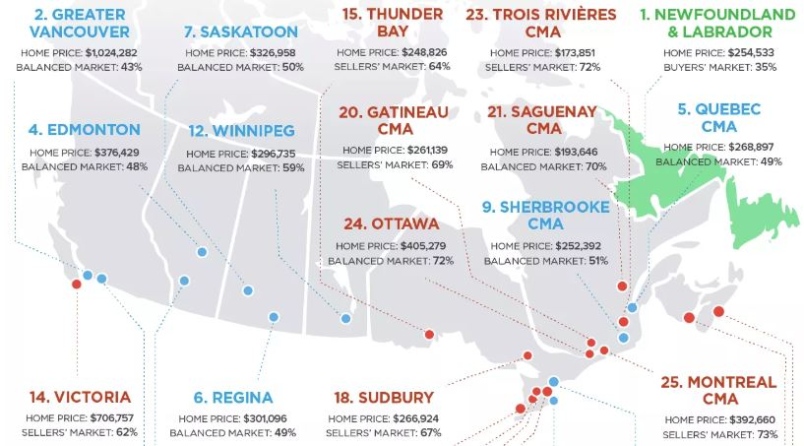
Once Canada’s most fiercely competitive real estate market and famed for its bidding wars, Greater Vancouver is now the second-least competitive housing market in the country, according to a new study by real estate website Zoocasa.
In its analysis of nationwide listings and sales data, Zoocasa found that, of the major real estate markets, only Newfoundland and Labrador was in a true buyer’s market, followed by Greater Vancouver and the Fraser Valley.
The website used sales-to-new-listings ratios to determine the state of the new market (as opposed to sales-to-active-listings ratios that are reported monthly by real estate boards). With this measure, a buyer’s market is indicated by anything under 40 per cent of new homes listed being sold that same month. Between 40 and 60 per cent it is a balanced market, and above 60 per cent it’s a seller’s market.
The study found that Greater Vancouver was at 43 per cent in July 2018, second-lowest only to Newfoundland and Labrador’s 35 per cent. The Fraser Valley was at 45 per cent.
The report said of these markets, “Those looking to ascend the property ladder in these cities will encounter fewer competitive hurdles such as bidding wars, as the sales are too few to outweigh new inventory.”
The regions in the strongest seller’s markets were London and St. Thomas at 78 per cent, Montreal at 73 per cent, and Ottawa and Trois Rivieres in joint third, both at 72 per cent.
The study also looked at the areas with the greatest year-over-year decreases in their sales-to-new-listings ratios. B.C. dominated the declines, with Fraser Valley seeing an annual decline of 15 percentage points, Greater Vancouver down 13 percentage points and Victoria dropping 12 percentage points (although still high at 62 per cent).
Zoocasa’s report said, “The last couple of years have been tumultuous in real estate markets across Canada, as a new mortgage stress test has further crimped affordability for borrowers of new mortgages. British Columbia, in particular, has weathered considerable challenges, as tougher mortgage hurdles compound with foreign buyer and speculation taxes, making steep affordability even more acute, and dampening home buyer demand. [These markets] have seen the greatest year-over-year declines in their sales-to-new-listings ratios, indicating faster rates of cooling competition.”
However, the study doesn’t account for differences between varying property types. The region’s latest board stats suggest that while Greater Vancouver is indeed in a balanced market overall, that breaks out as a buyer’s market for detached homes, a seller’s/balanced cusp market for attached units, and a seller’s market for condos.
Check out the infographic below for the nationwide study results.

The British Columbia Real Estate Association (BCREA) released its 2018 Third Quarter Housing Forecast Update today.
Multiple Listing Service® (MLS®) residential sales in the province are forecast to decline 21 per cent to 82,000 units this year, after recording 103,768 residential sales in 2017. MLS® residential sales are forecast to increase 8 per cent to 88,700 units in 2019. The 10-year average for MLS® residential sales in the province is 84,800 units.
“The BC housing market is grappling with a sharp decline in affordability caused by tough B20 stress test rules for conventional mortgages,” said Cameron Muir, BCREA Chief Economist. “While these rules have had a negative effect on housing demand across the country, the impact has been especially severe in BC’s large urban centres because of already strained housing affordability.”
In spite of the policy-driven downturn in housing demand, strong fundamentals continue to underpin the market. Demographics are highly favourable, especially the millennial generation who are now entering their household-forming years. In addition, low unemployment is leading to significant upward pressure on wages and, by extension, household wealth and confidence.
The pullback in BC home sales is helping alleviate a chronic shortage of supply. After trending at decade lows, active listings in the province were up nearly 20 per cent in July. The combination of slower housing demand and an increase in the inventory of homes for sale has trended most markets toward balanced conditions. This means more selection for home buyers, fewer multiple offer situations and less upward pressure on home prices.
Provided by: BCREA
Statistics released today by The Canadian Real Estate Association (CREA) show national home sales were up from June to July 2018.
Highlights:
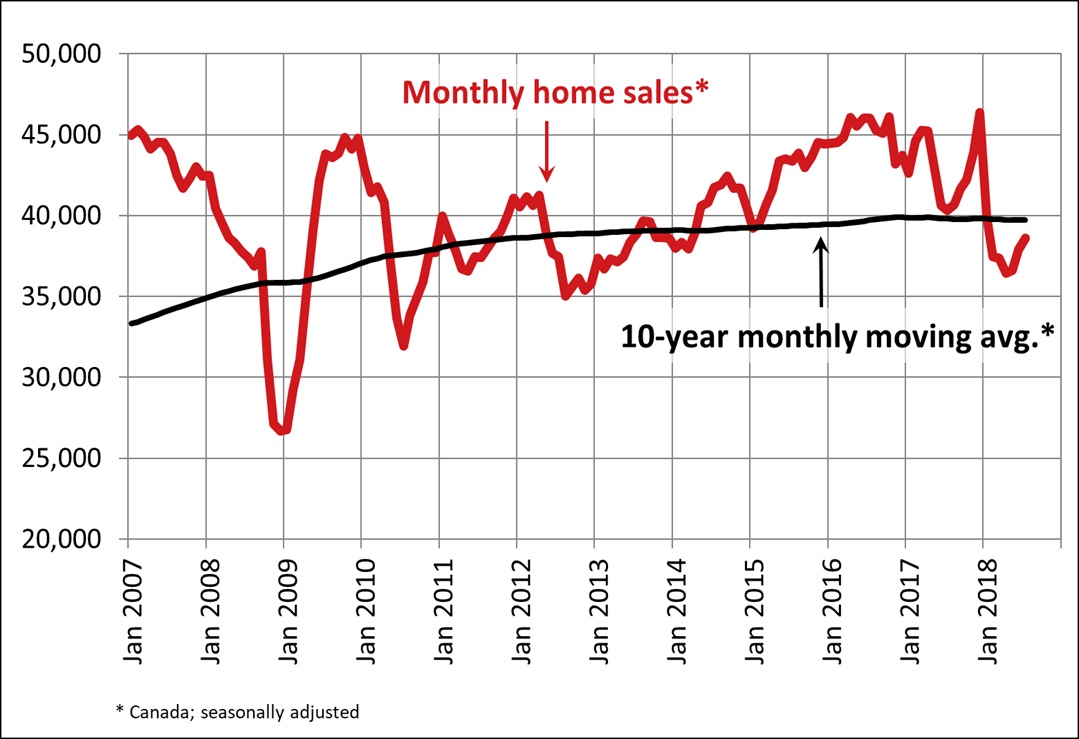
National home sales via Canadian MLS® Systems rose 1.9% in July 2018, building on increases in each of the two previous months but still running below levels recorded from mid-2013 to the end of last year (Chart A). Led by the Greater Toronto Area (GTA), more than half of all local housing markets reported an increase sales activity from June to July.
Actual (not seasonally adjusted) activity was down 1.3% y-o-y. The result reflects fewer sales in major urban centres in British Columbia and an offsetting improvement in activity in the GTA.
“This year’s new stress-test on mortgage applicants continues to weigh on home sales but its effect may be starting to fade slightly in Toronto and nearby markets,” said CREA President Barb Sukkau. “The degree to which the stress-test continues to sideline home buyers varies depending on location, housing type and price range. All real estate is local, and REALTORS® remain your best source for information about sales and listings where you live or might like to in the future,” said Sukkau.
“Improving national home sales activity in recent months obscures significant differences in regional trends for home sales and prices,” said Gregory Klump, CREA’s Chief Economist. “Regardless, rising interest rates and this year’s stress test on mortgage applicants will likely prove to be difficult hurdles to overcome for many would-be first time and move-up homebuyers, heading into the second half of the year and beyond.”
The number of newly listed homes retreated 1.2% in July and stood below monthly levels recorded over most of the past eight years. New listings were down in more than half of all local markets, led by Calgary, Edmonton and Greater Vancouver (GVA). Fewer new listings in these markets more than offset an increase in new supply in the GTA.
With sales up and new listings down, the national sales-to-new listings ratio tightened further to reach 55.9% in July. This reading nonetheless remains within short reach of the long-term average of 53.4% for this measure of market balance.
Considering the degree and duration to which market balance readings are above or below their long-term average is a useful way of gauging whether local housing market conditions favour buyers or sellers. As a rule of thumb, measures of market balance that are within one standard deviation of their long-term average are generally consistent with balanced market conditions.
Based on a comparison of the sales-to-new listings ratio with the long-term average, about two-thirds of all local markets were in balanced market territory in July 2018.
The number of months of inventory is another important measure for the balance between housing supply and demand. It represents how long it would take to liquidate current inventories at the current rate of sales activity.
There were 5.3 months of inventory on a national basis at the end of July 2018, down from 5.4 months in June and near the long-term average of 5.2 months.

The Aggregate Composite MLS® Home Price Index (MLS® HPI) was up 2.1% y-o-y in July 2018. This represents the first acceleration in y-o-y home price growth since April 2017. It also suggests that the dip in home prices last summer and their subsequent rebound in and around the GTA may contribute to further y-o-y gains in the months ahead.
Apartment units posted the largest y-o-y price gains in July (+10.1%), followed by townhouse/row units (+4.7%). By contrast, one-storey and two-storey single family home prices were again down from year-ago levels in July (-0.7% and -1.5% respectively) but the declines were noticeably smaller than in recent months.
Trends continue to vary widely among the 15 housing markets tracked by the MLS® HPI, with home prices up from year-ago levels in eight of them, little changed in two of them and down in the remainder.
Home price gains are diminishing on a y-o-y basis in the Lower Mainland of British Columbia (GVA: +6.7%; Fraser Valley: +13.8%), Victoria (+8.2%) and elsewhere on Vancouver Island (+13.7%).
Among Golden Horseshoe housing markets tracked by the index, home prices remained above year-ago levels in Guelph (+4.1%) and stabilized in Oakville-Milton (+0.1%). By contrast, home prices remained down on a y-o-y basis in the GTA (-0.6%) and Barrie and District (-3%).
In the Prairies, benchmark home prices remained down on a y-o-y basis in Calgary (-1.7%), Edmonton (-1.3%), Regina (-4.8%) and Saskatoon (-2.1%).
Meanwhile, benchmark home prices rose by 7.2% y-o-y in Ottawa (led by an 8.3% increase in two-storey single family home prices), by 5.7% in Greater Montreal (led by a 7% increase in townhouse/row unit prices) and by 5% in Greater Moncton (led by a 9.9% increase in apartment unit prices). (Table 1)
MLS® HPI provides the best way of gauging price trends because average price trends are strongly distorted by changes in the mix of sales activity from one month to the next.
The actual (not seasonally adjusted) national average price for homes sold in July 2018 was just under $481,500, up 1% from the same month last year. This was the first year-over-year increase since January.
The national average price is heavily skewed by sales in the GVA and GTA, two of Canada’s most active and expensive markets. Excluding these two markets from calculations cuts close to $100,000 from the national average price, trimming it to just under $383,000.
Provided by: CREA

Top Floor, South Facing
Investor Friendly Building
Priced at $458,800
BRAND NEW! Well might as well be. The Mariner, located in the heart of Hastings-Sunrise, centrally located to all sorts of amenities with a walk-score of 86, has been completely upgraded: full envelope replacement, roof, windows, balconies, railings, exterior lighting & update plumbing. All under warranty & recently completed. This is a must see. #404 is a top floor, bright south facing 1 bed & den, 1 bath, 609sqft home with an update bath & engineered flooring. Enjoy BBQs from a massive covered balcony. Bonus: 1 parking, hot water baseboard heat, rental & pet friendly. Act Now! Book your private viewing.

Lush Forest Backdrop
2 bed & Den Concrete Home
Open House Aug 18 from 1:00 to 3:00
Priced at $634,800
Beautiful greenbelt views. This 2bed+den/2bath/1097sqft corner unit has a spacious layout; perfect for an owner occupier or the discerning investor. Located in Novo I, UniverCity at SFU; Vancouver's premier lifestyle neighborhood. Features: freshly painted, quality floors, granite counters, SS apps, breakfast bar, lots of windows, covered balcony & cozy F/P. The master has tons of closet space & 3 pc ensuite, the 2nd bed is well sized & the large den w/French doors & windows easily fits a bed. Bonus: rental & pet friendly. Close to: transit, shopping, indoor/outdoor rec & a host of perks available only to UniverCity residents. Don't miss your chance to live in this area and enjoy a great lifestyle. Act Now! OPEN Aug 18 from 1 to 3pm.

The British Columbia Real Estate Association (BCREA) reports that a total of 7,055 residential unit sales were recorded by the Multiple Listing Service® (MLS®) across the province in July, a 23.9 per cent decrease from the same month last year. The average MLS® residential price in BC was $695,990, down 0.4 per cent from July 2017. Total sales dollar volume was $4.9 billion, a 24.2 per cent decline from July 2017.
“The BC housing market continues to grapple with the sharp decline in affordability caused by tough new mortgage qualification rules,” said Cameron Muir, BCREA Chief Economist. “However, less frenetic housing demand has created more balanced market conditions in many regions, leading to fewer multiple offers and more choice for consumers.”
Year-to-date, BC residential sales dollar volume was down 18.9 per cent to $37 billion, compared with the same period in 2017. Residential unit sales decreased 20.6 per cent to 50,926 units, while the average MLS® residential price was up 2.1 per cent to $725,639.
Provided by: BCREA

Gorgeous Endless Views
3 bed, 2 bath, 1427sqft
Priced at $974,800
Open: Aug 11 from 2 to 4
Stunning 270 degrees Mountain & Water views. Gorgeous & rare, SW facing 3bed/2bath/1427sqft home with 223sqft partially covered balcony, won't disappoint. Located in Aurora, of UniverCity at SFU, Vancouver's premier lifestyle neighborhood. Features: functional layout, 9' ceilings, expansive windows, tons of light, large kitchen w/loads of cupboard space, granite counters, gas stove & island w/breakfast bar. The master has walk-in closet & ensuite w/dble sinks & separate shower & soaker. Benefit from the spacious 2nd/3rd bedrms. Bonus: laundry rm, tons of in-suite storage, 2 parking & locker. Close to: transit, shopping, indoor/outdoor rec. & a host of perks available only to UniverCity residents. Act Now! OPEN HOUSE Aug 11 from 2 to 4pm.
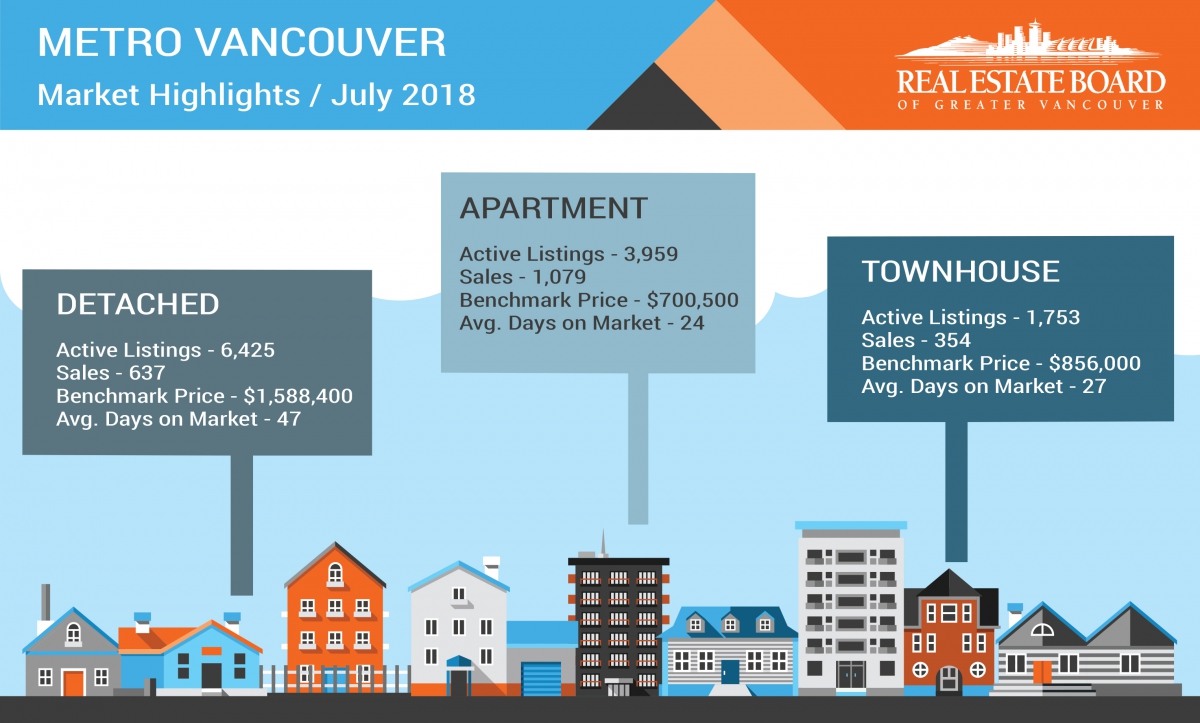
July’s residential housing sales in Metro Vancouver* reached their lowest levels for that month since the year 2000.
The Real Estate Board of Greater Vancouver (REBGV) reports that residential property sales in the region totalled 2,070 in July 2018, a 30.1 per cent decrease from the 2,960 sales recorded in July 2017, and a decrease of 14.6 per cent compared to June 2018 when 2,425 homes sold. Last month’s sales were 29.3 per cent below the 10-year July sales average.
“With fewer buyers active in today’s market, we’re seeing less upward pressure on home prices across the region,” Phil Moore, REBGV president said. “This is most pronounced in the detached home market, but demand in the townhome and apartment markets is also relenting from the more frenetic pace experienced over the last few years.”
There were 4,770 detached, attached and apartment properties newly listed for sale on the Multiple Listing Service® (MLS®) in Metro Vancouver in July 2018. This represents a 9.2 per cent decrease compared to the 5,256 homes listed in July 2017 and a 9.6 per cent decrease compared to June 2018 when 5,279 homes were listed.
The total number of properties currently listed for sale on the MLS® system in Metro Vancouver is 12,137, a 32 per cent increase compared to July 2017 (9,194) and a 1.6 per cent increase compared to June 2018 (11,947).
“Summer is traditionally a quieter time of year in real estate. This is particularly true this year,” Moore said. “With increased mortgage rates and stricter lending requirements, buyers and sellers are opting to take a wait-and-see approach for the time being.”
For all property types, the sales-to-active listings ratio for July 2018 is 17.1 per cent. By property type, the ratio is 9.9 per cent for detached homes, 20.2 per cent for townhomes, and 27.3 per cent for condominiums.
Generally, analysts say that downward pressure on home prices occurs when the ratio dips below the 12 per cent mark for a sustained period, while home prices often experience upward pressure when it surpasses 20 per cent over several months.
The MLS® Home Price Index composite benchmark price for all residential properties in Metro Vancouver is currently $1,087,500. This represents a 6.7 per cent increase over July 2017 and a 0.6 per cent decrease compared to June 2018.
Sales of detached properties in July 2018 reached 637, a decrease of 32.9 per cent from the 949 detached sales recorded in July 2017. The benchmark price for detached properties is $1,588,400. This represents a 1.5 per cent decrease from July 2017 and a 0.6 per cent decrease compared to June 2018.
Sales of apartment properties reached 1,079 in July 2018, a decrease of 26.5 per cent compared to the 1,468 sales in July 2017. The benchmark price of an apartment property is $700,500. This represents a 13.6 per cent increase from July 2017 and a 0.5 per cent decrease compared to June 2018.
Attached property sales in July 2018 totalled 354, a decrease of 34.8 per cent compared to the 543 sales in July 2017. The benchmark price of an attached unit is $856,000. This represents a 12.1 per cent increase from July 2017 and a 0.4 per cent decrease compared to June 2018.
Click here for full stats package....
Provided by: REBGV
Call 604-377-3689 or Email me today and let's discuss your next home sale or purchase.