RSS

Despite an easing in prices, the Canadian housing market remains “highly vulnerable,” according to the Canadian Mortgage and Housing Corporation.


Home sales and prices are coming down in Vancouver, but it is still an overheated market, according to a Canada Mortgage and Housing Corporation’s latest look at stability in real estate markets across the country.


“Metro Vancouver’s housing market remains highly vulnerable despite softening prices in the resale market,” said Eric Bond, CMHC’s Vancouver-based analyst.


“There are imbalances even though prices are declining for properties in different segments, in the most recent quarter, because home price growth over the past few years has significantly outpaced local income growth.”


The CMHC’s Housing Market Assessment report released Thursday looked at overheating, price acceleration and overvaluation.


Overheating in the Vancouver market “was first detected” in the last quarter of 2015, according to the report.

Now, the sales-to-new-listings-ratio, which is a way of measuring the balance between demand and supply, is below the 75 per cent threshold designated by the CMHC to trigger an overheating warning.


However, the agency is maintaining Vancouver’s market is overheated because the CMHC model has a “persistence” rule defined by there being a trigger in at least one quarter in the previous three years.


Also, even though the overall sales-to-new-listings ratio for Metro Vancouver has been dropping in 2018, the agency says they have varied widely depending on market location and type.


In the third quarter of 2017, the sales-to-new-listings ratio for single-detached homes ranged from the lowest in West Vancouver of six per cent to a high of 32 per cent in Port Coquitlam. A year later in the third quarter of 2018, it dropped to four per cent in West Vancouver, but saw a much larger drop to 14 per cent in Port Coquitlam.

For condos, there were some steep changes in sales-to-new-listing ratios from 51 per cent in the third quarter of 2017 to 16 per cent in 2018 in Langley, and 40 per cent to 16 per cent in Surrey.


The report first identified price acceleration in the Vancouver market in the second quarter of 2016. Its definition is based again on a significant price increase in at least one quarter in the previous three years and says that “rapid short-term price gains can attract investors and promote speculative activity that pushes prices further upwards.”


“Price growth has slowed considerably so far in 2018 and has turned negative over the past six months in most areas. Declining prices for detached properties in particular are due to high inventories that have accumulated due to sustained declining sales volumes.”


Lastly, when it comes to overvaluation, there is still “high evidence” that in the second quarter of 2018 “current price levels are higher than the estimated values from price models based on demand and supply fundamental factors such as population, income and financing costs.”


There are signs that in the second quarter of 2018 price levels started to move down below the threshold for determining overvaluation and closer to “the actual values of an array of price measures.”


However, “the rating is maintained because the indicator has been above the threshold for at least two quarters over the past year.”


“High price levels coupled with rising mortgage rates since the second half of 2017 continue to stretch home affordability in (Vancouver.)”


Provided by: Joanne Lee-Young for The Vancouver Sun & CMHC

Read

The Bank of Canada today increased its target for the overnight rate to 1 ¾ per cent. The Bank Rate is correspondingly 2 per cent and the deposit rate is 1 ½ per cent.

The global economic outlook remains solid. The US economy is especially robust and is expected to moderate over the projection horizon, as forecast in the Bank’s July Monetary Policy Report (MPR). The new US-Mexico-Canada Agreement (USMCA) will reduce trade policy uncertainty in North America, which has been an important curb on business confidence and investment. However, trade conflict, particularly between the United States and China, is weighing on global growth and commodity prices. Financial market volatility has resurfaced and some emerging markets are under stress but, overall, global financial conditions remain accommodative.


The Canadian economy continues to operate close to its potential and the composition of growth is more balanced. Despite some quarterly fluctuations, growth is expected to average about 2 per cent over the second half of 2018. Real GDP is projected to grow by 2.1 per cent this year and next before slowing to 1.9 per cent in 2020.


The projections for business investment and exports have been revised up, reflecting the USMCA and the recently-approved liquid natural gas project in British Columbia. Still, investment and exports will be dampened by the recent decline in commodity prices, as well as ongoing competitiveness challenges and limited transportation capacity. The Bank will be monitoring the extent to which the USMCA leads to more confidence and business investment in Canada.


Household spending is expected to continue growing at a healthy pace, underpinned by solid employment income growth. Households are adjusting their spending as expected in response to higher interest rates and housing market policies. In this context, household credit growth continues to moderate and housing activity across Canada is stabilizing. As a result, household vulnerabilities are edging lower in a number of respects, although they remain elevated.


CPI inflation dropped to 2.2 per cent in September, in large part because the summer spike in airfares was reversed. Other temporary factors pushing up inflation, such as past increases in gasoline prices and minimum wages, should fade in early 2019. Inflation is then expected to remain close to the 2 per cent target through the end of 2020. The Bank’s core measures of inflation all remain around 2 per cent, consistent with an economy that is operating at capacity. Wage growth remains moderate, although it is projected to pick up in the coming quarters, consistent with the Bank’s latest Business Outlook Survey.


Given all of these factors, Governing Council agrees that the policy interest rate will need to rise to a neutral stance to achieve the inflation target. In determining the appropriate pace of rate increases, Governing Council will continue to take into account how the economy is adjusting to higher interest rates, given the elevated level of household debt. In addition, we will pay close attention to global trade policy developments and their implications for the inflation outlook.

Read

Luxury home sales in two of Canada’s most expensive markets are down from a year, as the high-end real estate market feels the effect of foreign buyers taxes.


TORONTO — Sales of luxury homes in two of Canada’s most expensive cities fell this year, as the high-end real estate market continued to feel the impact of foreign buyers taxes.


Realty brokerage Re/Max says sales of single-detached homes priced from $1 million to $2 million fell 35 per cent from a year ago in both Toronto and Vancouver.


According to the annual report, released Tuesday, sales of single-detached homes in the $2-million-to-$3-million range were down 50 per cent in Toronto and 22 per cent in Vancouver.


Meanwhile, homes that were sold for more than $3 million dropped 44 per cent in Toronto and 45 per cent in Vancouver.


Re/Max says homebuyers have been grappling with the introduction of foreign buyers taxes in Ontario and B.C., along with increased property transfer taxes and school taxes on B.C. homes over $3 million.


“All the new rules that the government implemented, along with the foreign buyers tax and the new lending regulations, it all just put a crunch on the most expensive part of the market,” said Christopher Alexander, executive vice-president and regional director of Re/Max Integra’s Ontario-Atlantic business.


He says luxury homeowners may have also been hesitant to list this year amid signs that the country’s housing market may be cooling, choosing instead to “wait it out.”


Although luxury home sales are weakening, sales in the low-end of the luxury condo market saw increases driven mainly by millennials who are using their inheritances and baby boomers looking to downsize, the report said.

Alexander says condos appeal to baby boomers because they can get more value for their money, especially in the major cities.


“Most of them have put all their kids in school. They don’t need so much space anymore. Their single-detached home is worth a fortune and now they can buy a really nice luxury condo that is not as big in a really great urban area where they have access to a more urbanized lifestyle, more action,” he said.


“Luxury is not just about price. A lot of it has to do with pedigree. If you buy with a million in Toronto or Vancouver, it doesn’t get you a luxury home but if you get a suite in the Four Seasons or the Shangri-La or the Ritz-Carlton. You’re going to get a small condo in a luxury building with all the luxury amenities. You’ve got that pedigree piece that is appealing to the higher end of the market.”


The report says condo sales in the $1-million-to-$2-million range were up two per cent year over year in Toronto and six per cent in Vancouver. Calgary saw their condo sales in this price range jump by three per cent, while Victoria sales climbed 19 per cent.


The most expensive condominium sold in Toronto in 2018 so far was priced at $11.5 million, topping the $8 million that was paid for the most expensive condo sold in 2017. The priciest condo sold in Vancouver so far this year was $11.7 million, up 34 per cent from the top price of $8.7 million paid last year.


Provided by: The Canadian Press

Read

The British Columbia Real Estate Association welcomes the Government of British Columbia’s inclusion of exemptions from the speculation and vacancy tax proposed as Bill 45 today, Tuesday, October 16, 2018. Some of the exemptions directly address concerns BCREA brought to the Province’s attention through its advocacy work.

The Bill allows for exemptions for British Columbians going through traumatic life events such as illness and divorces or separations. It also allows for exemptions for owners of properties that are being developed or undergoing renovations.

It also exempts strata units from a vacancy tax for 2018 and 2019, where strata restrictions prohibit rentals. Further clarity is needed on this exemption and other implications.

BCREA, its 11 regional real estate boards and the 23,000 REALTORS® they represent look forward to providing the Province with REALTOR® insight on the implementation of Bill 45 to ensure that the best interests of BC homeowners are served.

Read the Province’s news release here. Learn more about the speculation and vacancy tax here.


Provided by: BCREA

Read

My brother and I used Hafez off a recommendation from my Dad's co-worker to buy our first home! And he has been excellent at helping us navigate this complicated purchase. As well as great advice when he got a bad feeling to make sure we found the place that is right for us. Now we haven't got the keys just yet but it has been an easy and smooth process and I'm sure the final stages will be as well. He is quick to respond to any questions and even quicker to arrange showings that worked around our busy work schedule so we didn't miss out! I don't have much experience in the home buying process, since this is my first, but I would definitely recommend using him as he the best!


C.M. & K.M.

Read

Canadian home sales activity edges lower in September


Statistics released today by The Canadian Real Estate Association (CREA) show national home sales edged down slightly between August and September 2018.


Highlights:

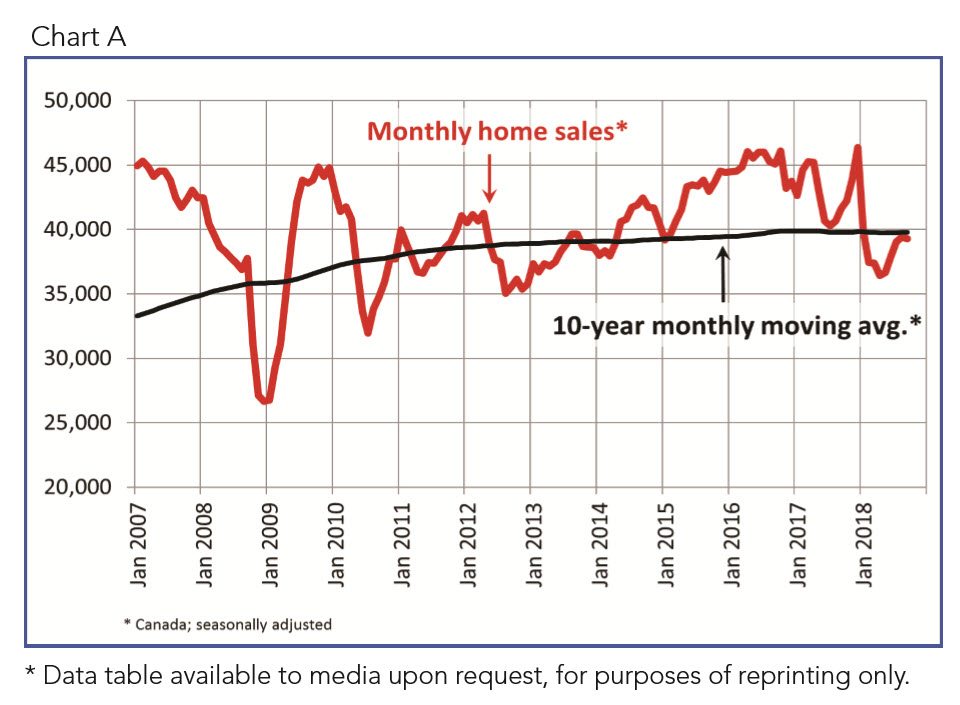
  • National home sales edged back 0.4% from August to September.
  • Actual (not seasonally adjusted) activity was down by 8.9% from one year ago.
  • The number of newly listed homes rose by 3% from August to September.
  • The MLS® Home Price Index (HPI) was up 2.3% year-over-year (y-o-y) in September.
  • The national average sale price edged up a slight 0.2% y-o-y in September.

National home sales via Canadian MLS® Systems eased by 0.4% in September 2018, marking the first decline since April. While sales activity is still somewhat stronger compared to the first half of this year, it remains well below most other months since 2014. (Chart A)


Sales declined from August to September in slightly more than half of all local markets, led by Vancouver Island and Edmonton, along with several markets in Ontario’s Greater Golden Horseshoe (GGH) Region. Activity declines in these markets were offset by monthly gains in the Fraser Valley and Montreal.


Actual (not seasonally adjusted) activity was down 8.9% compared to September 2017.


About 70% of local markets were down on a y-o-y basis, led primarily by declines in major urban centres in British Columbia, along with Calgary, Edmonton and Winnipeg.


“The balance between the number of home buyers and suitable homes varies depending on location, housing type and price range,” said CREA President Barb Sukkau. “Differences in market balance will likely come into sharper focus as interest rates rise and cause this year’s new mortgage stress-test to become even more restrictive. A professional REALTOR® is your best source for information and guidance in negotiating a purchase or sale of a home during these changing times,” said Sukkau.


The number of newly listed homes rose 3% between August and September, led by the Lower Mainland and the Greater Toronto Area (GTA). More than half of all local markets posted a monthly increase in new listings, which was offset by declines in excess of 3% in more than half of the remaining local markets.


“Sales activity may get all the press but it’s the balance between that and the number of homes for sale that sets the tone for pricing environment,” said Gregory Klump, CREA’s Chief Economist. “In markets with an abundant supply of homes and slower sales activity, buyers have the upper hand when it comes to negotiations over price. However, in places where buyers are keen to make a purchase but there’s a shortage of homes for sale, sellers are in the driver’s seat when it comes to price. It will be interesting to see how supply and demand respond to rising interest rates amid this year’s new mortgage stress-test.” 


With sales down slightly and new listings up, the national sales-to-new listings ratio eased to 54.4% in September compared to 56.2% in July and August. The long-term average for this measure of market balance is 53.4%.


Considering the degree and duration to which market balance readings are above or below their long-term average is a way of gauging whether local housing market conditions favour buyers or sellers. As a rule of thumb, measures of market balance that are within one standard deviation of their long-term average are generally consistent with balanced market conditions.


Based on a comparison of the sales-to-new listings ratio with the long-term average, about three-quarters of all local markets were in balanced market territory in September 2018.


The number of months of inventory is another important measure for the balance between housing supply and demand. It represents how long it would take to liquidate current inventories at the current rate of sales activity.


There were 5.3 months of inventory on a national basis at the end of August 2018. While this is in line with the measure’s long-term average nationally, the number of months of inventory is well above its long-term average in all Prairie provinces and in Newfoundland & Labrador.


The Aggregate Composite MLS® Home Price Index (MLS® HPI) was up 2.3% y-o-y in September 2018. The increase was in line with those posted in each of the two previous months. (Chart B)


Apartment units posted the largest y-o-y price gains in September (+8.4%), followed by townhouse/row units (+4.5%). Meanwhile, one-storey and two-storey single family home prices were little changed on a y-o-y basis in September (-0.3% and -0.3% respectively).


Trends continue to vary widely among the 17 housing markets tracked by the MLS® HPI. In British Columbia, home price gains are diminishing on a y-o-y basis in the Lower Mainland (Greater Vancouver (GVA): +2.2%; Fraser Valley: +8.5%). Meanwhile, prices in Victoria were up 8.7% y-o-y in September. Elsewhere on Vancouver Island they climbed 13.2%.


Among the housing markets in the Greater Golden Horseshoe region that are tracked by the index, home prices were up from year-ago levels in Guelph (+8%), Hamilton-Burlington (+6.1%), the Niagara Region (+5.9%), the GTA (+2%), and Oakville-Milton (+1.4%). By contrast, home prices slipped lower in Barrie and District (-3.6%).

Across the Prairies, benchmark home prices remained below year-ago levels in Calgary (-2.6%), Edmonton (-2.6%), Regina (-4.7%) and Saskatoon (-1.9%).


Home prices rose by 6.9% y-o-y in Ottawa (led by an 7.9% increase in two-storey single family home prices), by 6.1% in Greater Montreal (led by a 7% increase in townhouse/row unit prices) and by 3.4% in Greater Moncton (led by a 10.3% increase in apartment unit prices). (Table 1)


The MLS® HPI provides the best way of gauging price trends because average price trends are strongly distorted by changes in the mix of sales activity from one month to the next.


The actual (not seasonally adjusted) national average price for homes sold in September 2018 was just under $487,000, little changed (+0.2%) from the same month last year.


The national average price is heavily skewed by sales in the GVA and GTA, two of Canada’s most active and expensive markets. Excluding these two markets from calculations cuts almost $104,000 from the national average price, trimming it to just over $383,000.


PLEASE NOTE: The information contained in this news release combines both major market and national sales information from MLS® Systems from the previous month.


CREA cautions that average price information can be useful in establishing trends over time, but does not indicate actual prices in centres comprised of widely divergent neighbourhoods or account for price differential between geographic areas. Statistical information contained in this report includes all housing types.


MLS® Systems are co-operative marketing systems used only by Canada’s real estate Boards to ensure maximum exposure of properties listed for sale.


The Canadian Real Estate Association (CREA) is one of Canada’s largest single-industry trade associations. CREA works on behalf of more than 125,000 REALTORS® who contribute to the economic and social well-being of communities across Canada. Together they advocate for property owners, buyers and sellers.


Further information can be found at http://crea.ca/statistics.

Read

BC Home Sales Continue at Slower Pace in September

Vancouver, BC – October 11, 2018. The British Columbia Real Estate Association (BCREA) reports that a total of 5,573 residential unit sales were recorded by the Multiple Listing Service® (MLS®) across the province in September, a 33.2 per cent decrease from the same month last year. The average MLS® residential price in BC was $685,749, down 1.1 per cent from September 2017. Total sales dollar volume was $3.8 billion, a 34 per cent decline from September 2017.


“BC home sales continue at a slower pace compared to last year,” said Cameron Muir, BCREA Chief Economist. “The

impact on affordability and purchasing power caused by the mortgage stress test and moderately higher interest rates are negating the effect of the extraordinarily strong performance of BC’s economy over the last five years.”


Year-to-date, BC residential sales dollar volume was down 21.3 per cent to $45 billion, compared with the same period in 2017. Residential unit sales decreased 22.5 per cent to 63,251 units, while the average MLS® residential price was up 1.5 per cent to $716,096.

Read

JUST SOLD: 314 8511 Westminster, Richmond, BC

Excellent Central Location

Investor Friendly Building

Priced at $365,000


Click here for more info...


Top Floor, West Facing. Bright and spacious. Perfect starter home, great for down sizers or excellent investment property. Your search ends here. This 1 bed, 1 bath, 679sqft home features an open floor plan, updated kitchen with new back splash and newer stainless appliances, updated bathroom, insuite laundry & cozy wood F/P. The large master offers plenty of space for furniture & a well sized closet. Benefits: plenty of insuite storage, parking and pet & rental friendly. Location can't be beat: close to shopping, recreation, Kwantlen College & Sky Train Line. Act Now. Call today.

Read

More supply and less demand seen across Metro Vancouver housing market

The supply of homes for sale continued to increase across the Metro Vancouver* housing market in September while home buyer demand remained below typical levels for this time of year.


The Real Estate Board of Greater Vancouver (REBGV) reports that residential property sales in the region totalled 1,595 in September 2018, a 43.5 per cent decrease from the 2,821 sales recorded in September 2017, and a 17.3 per cent decrease compared to August 2018 when 1,929 homes sold.


Last month’s sales were 36.1 per cent below the 10-year September sales average.


“Fewer home sales are allowing listings to accumulate and prices to ease across the Metro Vancouver housing market,” Ashley Smith, REBGV president-elect said. “There’s more selection for home buyers to choose from today. Since spring, home listing totals have risen to levels we haven’t seen in our market in four years.”


There were 5,279 detached, attached and apartment properties newly listed for sale on the Multiple Listing Service® (MLS®) in Metro Vancouver in September 2018. This represents a 1.8 per cent decrease compared to the 5,375 homes listed in September 2017 and a 36 per cent increase compared to August 2018 when 3,881 homes were listed.


The total number of properties currently listed for sale on the MLS® system in Metro Vancouver is 13,084, a 38.2 per cent increase compared to September 2017 (9,466) and a 10.7 per cent increase compared to August 2018 (11,824).


For all property types, the sales-to-active listings ratio for September 2018 is 12.2 per cent. By property type, the ratio is 7.8 per cent for detached homes, 14 per cent for townhomes, and 17.6 per cent for condominiums.


Generally, analysts say that downward pressure on home prices occurs when the ratio dips below the 12 per cent mark for a sustained period, while home prices often experience upward pressure when it surpasses 20 per cent over several months.


“Metro Vancouver’s housing market has changed pace compared to the last few years. Our townhome and apartment markets are sitting in balanced market territory and our detached home market remains in a clear buyers’ market,” Smith said. “It’s important for both home buyers and sellers to work with their Realtor to understand what these trends means to them.”


The MLS® Home Price Index composite benchmark price for all residential properties in Metro Vancouver is currently $1,070,600. This represents a 2.2 per cent increase over September 2017 and a 3.1 per cent decrease over the last three months.


Sales of detached properties in September 2018 reached 508, a 40.4 per cent decrease from the 852 detached sales recorded in September 2017. The benchmark price for detached properties is $1,540,900. This represents a 4.5 per cent decrease from September 2017 and a 3.4 per cent decrease over the last three months.


Sales of apartment properties reached 812 in September 2018, a 44 per cent decrease compared to the 1,451 sales in September 2017. The benchmark price of an apartment property is $687,300. This represents a 7.4 per cent increase from September 2017 and a 3.1 per cent decrease over the last three months.


Attached property sales in September 2018 totalled 275, a 46.9 per cent decrease compared to the 518 sales in September 2017. The benchmark price of an attached unit is $837,600. This represents a 6.4 per cent increase from September 2017 and a two per cent decrease over the last three months.

Click here for complete package...

Read

Just Listed: 404 2328 Oxford St., Vancouver East, Hastings

Top Floor, South Facing

Investor Friendly Building

Priced at $418,000


Click here for more info...


BRAND NEW! Well might as well be. The Mariner, located in the heart of Hastings-Sunrise, centrally located to all sorts of amenities with a walk-score of 86, has been completely upgraded: full envelope replacement, roof, windows, balconies, railings, exterior lighting & update plumbing. All under warranty & recently completed. This is a must see. #404 is a top floor, bright south facing 1 bed & den, 1 bath, 609sqft home with an update bath & engineered flooring. Enjoy BBQs from a massive covered balcony. Bonus: 1 parking, hot water baseboard heat, rental & pet friendly. Act Now! Book your private viewing.

Read

Just Listed: 314 8511 Westminster Hwy., Richmond, Brighouse

Excellent Central Location

Investor Friendly Building

Priced at $365,000


Click here for more info...


Top Floor, West Facing. Bright and spacious. Perfect starter home, great for down sizers or excellent investment property. Your search ends here. This 1 bed, 1 bath, 679sqft home features an open floor plan, updated kitchen with new back splash and newer stainless appliances, updated bathroom, insuite laundry & cozy wood F/P. The large master offers plenty of space for furniture & a well sized closet. Benefits: plenty of insuite storage, parking and pet & rental friendly. Location can't be beat: close to shopping, recreation, Kwantlen College & Sky Train Line. Act Now. Call today.

Read
Reciprocity Logo The data relating to real estate on this website comes in part from the MLS® Reciprocity program of either the Greater Vancouver REALTORS® (GVR), the Fraser Valley Real Estate Board (FVREB) or the Chilliwack and District Real Estate Board (CADREB). Real estate listings held by participating real estate firms are marked with the MLS® logo and detailed information about the listing includes the name of the listing agent. This representation is based in whole or part on data generated by either the GVR, the FVREB or the CADREB which assumes no responsibility for its accuracy. The materials contained on this page may not be reproduced without the express written consent of either the GVR, the FVREB or the CADREB.