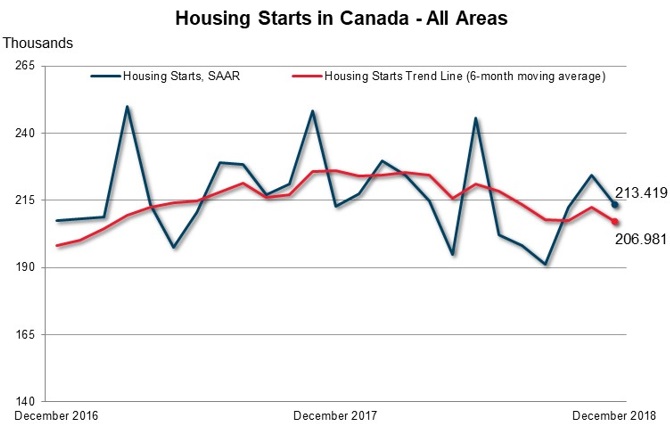
The trend in housing starts was 206,981 units in December 2018, compared to 212,338 units in November 2018, according to Canada Mortgage and Housing Corporation (CMHC). This trend measure is a six-month moving average of the monthly seasonally adjusted annual rates (SAAR) of housing starts.
"The national trend in housing starts decreased in December, the fifth decline in the last six months," said Bob Dugan, CMHC's chief economist. "Reflecting these recent declines, total annual housing starts in 2018 were lower than in 2017, as lower single-detached starts more than offset a slight increase in multi-family starts this year.
Nonetheless, total housing starts remain elevated when compared to historical averages."
Monthly Highlights
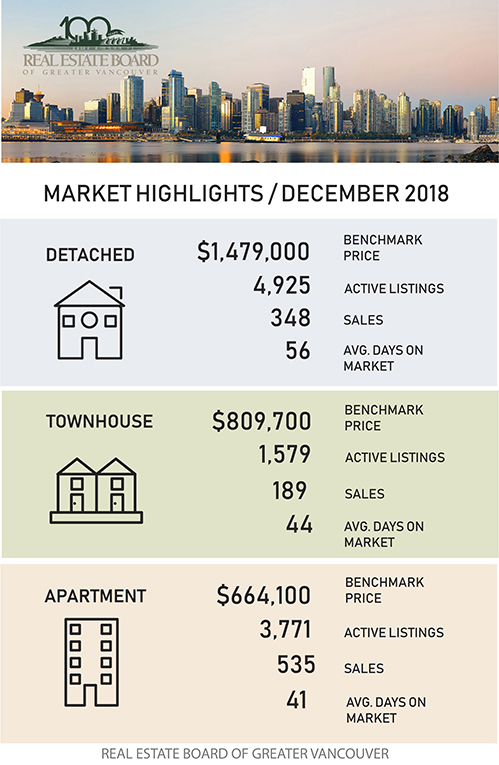
Vancouver
Housing starts in the Vancouver Census Metropolitan Area (CMA) continued trending lower in December 2018, ending the year with an 11% decrease compared to 2017 despite that rental units rose by 40% in response to a tight rental market. City of Vancouver’s rental and condo sectors are the top two drivers to the annual housing starts. Surrey led the overall decline with housing starts down by 27% in 2018.
Victoria
Total year-to-date housing starts initiated in Metro Victoria reached a level not seen since 1976 in December. Rental units were half of all housing starts in 2018 in response to heightened rental demand and low vacancy rates.
Edmonton
Edmonton housing starts trended lower in December as inventory levels remained elevated. On an annual basis, Edmonton starts were 12% below 2017 levels, which reflects lower demand driven by the current economic climate in Alberta. Starts for all types of units were lower, except for row units, which grew by 13%.
Regina
December total housing starts trended lower due to a decline in multi-family construction. In 2018, housing starts in the Regina CMA declined by 41% to 1,139 units from 1,923 in 2017. Single-detached starts declined by 47%, while multi-family starts were lower by 37%, compared to the previous year. A weak labour market, tighter credit market conditions, rising construction costs and elevated resale supply - all combined to reduce demand for newly constructed homes.
Kingston
Kingston recorded the highest number of starts in any given month since September 2013. Rental apartments accounted for 77% of total starts in December. These new rental units will contribute needed supply to the market, as the apartment vacancy rate in Kingston has been trending lower since 2016. The total number of housing starts in 2018 was significantly above the 5-year average, with gains for all dwelling types.
Toronto
In 2018, the Toronto CMA saw the most apartment starts ever recorded and overall housing starts were up 6% from a year ago. High prices, borrowing costs, and a widening price gap with resale market alternatives weighed down significantly on single-detached starts, which were the lowest in almost four decades. The deteriorating affordability for low-rise homes has fueled the demand for relatively affordable higher-density housing.
Hamilton
Annual housing starts in Hamilton CMA were the highest since 2004, despite the trend measure moving down in December. Apartment starts were primarily responsible for the high number of overall housing starts in 2018, having reached their highest level in over 40 years. In 2018, more buyers gravitated to less expensive homes and competition for vacant rental units intensified, both of which led to greater demand for new apartments. The appetite for new apartments was widespread across Hamilton CMA in 2018, occurring in each of three major markets, Burlington, Hamilton and Grimsby.
Brantford
A high number of housing starts for December helped annual starts to surpass the 700 mark for just the second time in the past ten years. The price point of new low-rise homes in Brantford attracted more growing families and empty nesters from nearby Hamilton and West GTA markets compared to most years. Single-detached starts rebounded from a slow 2017, while row starts continued to trend up to their highest level since CMHC began tracking starts activity in Brantford over 40 years ago.
Montréal
Housing starts in the Montréal area increased slightly in 2018 compared to 2017 (+1%). The decline recorded in the construction of condos (-6%) during this period was more than offset by rental apartment starts (+8%) which hit a 30-year record high. Just under half of all housing starts in the Montreal CMA in 2018 were intended for the rental market, including starts of rental retirement homes. However, most rental starts were intended for the larger non-retirement home sector. Relatively low vacancy rates, the aging population, and stronger demand from young households were likely all factors that stimulated residential construction in the rental market segment.
Province of Québec
The total number of housing starts in Quebec’s urban areas in 2018 was practically the same as in 2017. Residential construction in the past year continued to be supported by multi-unit housing starts, a large part of which were rental housing units. This was the case notably in Montréal and Québec. Overall, the growth in the supply of apartments in the province was stimulated by the aging of the population and by immigration.
Halifax
Total housing starts in Halifax picked up pace in December due to a rise in apartment construction. By year-end 2018, multiples starts were up 6% compared to 2017 figures, driven by strong rental demand and migration. Apartment construction in 2018 was predominantly located in the suburban markets of Hammonds Plains and Mainland North, as well as on the Halifax Peninsula.
Prince Edward Island (PEI)
Total housing starts in PEI were 156% higher in December compared to a year ago. Singles were up by 9% and multiples by 347%, which contributed directly to the considerable monthly increase. This was driven by new multi-unit apartment and seniors’ condo projects, in reaction to a near zero vacancy rate on the Island. For 2018, total starts were up 26%, driven primarily by strong job growth and positive international immigration throughout the year.
CMHC uses the trend measure as a complement to the monthly SAAR of housing starts to account for considerable swings in monthly estimates and obtain a more complete picture of Canada’s housing market. In some situations analyzing only SAAR data can be misleading, as they are largely driven by the multi-unit segment of the market which can vary significantly from one month to the next.
The standalone monthly SAAR of housing starts for all areas in Canada was 213,419 units in December, down from 224,349 units in November. The SAAR of urban starts decreased by 5.8% in December to 194,594 units. Multiple urban starts decreased by 6.8% to 144,728 units in December while single-detached urban starts decreased by 2.6% to 49,866 units.
Rural starts were estimated at a seasonally adjusted annual rate of 18,825 units.
Provided by: CMHC