Gorgeous Loft Style Home
3bed, 2 bath 1815sqft
Open: April 6 from 1 to 3
Price at $1,098,800

Gorgeous Loft Style Home
3bed, 2 bath 1815sqft
Open: April 6 from 1 to 3
Price at $1,098,800

The Bank of Canada is keeping its key interest rate unchanged as it releases a downgraded 2019 growth forecast that includes a prediction the economy nearly came to a halt at the start of the year.
The central bank also appears to be in no hurry to move the interest rate any time soon because, unlike recent statements, the announcement today removed all mentions of a need for future increases.
The decision leaves the trend-setting rate at 1.75% for a fourth-straight announcement -- a pause that followed governor Stephen Poloz's stretch of five hikes between mid-2017 and last fall.
The bank says the economy was operating close to full tilt for most of 2017 and 2018 before a sudden deceleration in the final months of last year, which was largely caused by a drop in oil prices and unexpectedly weak numbers for investment and exports.
In new projections today, the bank is predicting growth of real gross domestic product of 1.2% for 2019, down from its January forecast of 1.7%.
The Bank of Canada is projecting growth of just 0.3% in the first quarter of 2019, though it's predicting the economy to pick up its pace in the second quarter on expectations of stronger housing activity, consumption and business investment.
Provided by the: Canadian Press

Single Level Duplex Style
End Unit with Updates
Price at $714,800

Huge 1 Bed & Den
243sqft Fully Covered Patio
Open: April 27 from 1 to 3
Price at $524,800
Looking for a home with more space? Your search is over! Welcome to this exceptionally large 1 bed & den (easily 2 bed), 1 bath, 829sqft home. Located in Altaire, a concrete building at UniverCity; Vancouver's premier lifestyle neighborhood. Features: spacious open layout, dining & living rooms to accommodate full size furniture, a kitchen with plenty of counter & cupboard space, SS apps, cozy F/P, extra storage plus a 243sqft fully covered patio. The well sized master has pass-through closets & access to a cheater ensuite. The 2nd bed (den) provides plenty of room. Close to: transit, shopping, nature, indoor/outdoor rec. & a host of amenities available only to UniverCity residents. Act Now! Open April 27 from 1 to 3.
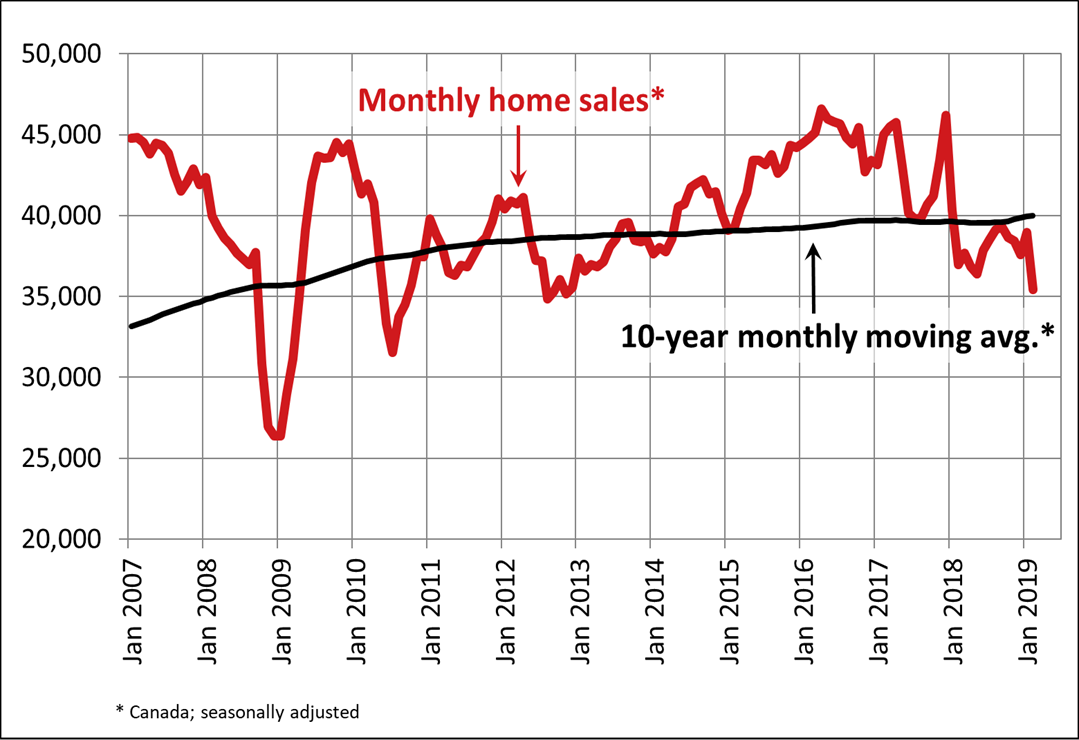
Statistics released today by the Canadian Real Estate Association (CREA) show national home sales edged higher in March 2019 after having declined sharply the previous month.
Highlights:
Home sales via Canadian MLS® Systems edged up 0.9% in March 2019 following a sharp drop in February, leaving activity near some of the lowest levels recorded in the last six years. (Chart A)
There was an even split between the number of markets where sales rose from the previous month and those where they waned. Among Canada’s larger cities, activity improved in Victoria, the Greater Toronto Area (GTA), Oakville-Milton and Ottawa, whereas it declined in Greater Vancouver, Edmonton, Regina, Saskatoon, London and St. Thomas, Sudbury and Quebec City.
Actual (not seasonally adjusted) sales activity fell 4.6% y-o-y to the weakest level for the month since 2013. It was also almost 12% below the 10-year average for March. That said, in British Columbia, Alberta and Saskatchewan, sales were more than 20% below their 10-year average for the month. By contrast, activity is running well above-average in Quebec and New Brunswick.
“It will be some time before policy measures announced in the recent Federal Budget designed to help first-time homebuyers take effect,” said Jason Stephen, CREA’s President. “In the meantime, many prospective homebuyers remain sidelined by the mortgage stress-test to varying degrees depending on where they are looking to buy. All real estate is local, and REALTORS® remain your best source for information about sales and listings where you live or might like to in the future,” added Stephen.
“March results suggest local market trends are largely in a holding pattern,” said Gregory Klump, CREA’s Chief Economist. “While the mortgage stress test has made access to home financing more challenging, the good news is that continuing job growth remains supportive for housing demand and should eventually translate into stronger home sales activity pending a reduction in household indebtedness,” he added.
The number of newly listed homes rose 2.1% in March. New supply rose in about two-thirds of all local markets, led by Winnipeg, Regina, Victoria and elsewhere on Vancouver Island. By contrast, new listings declined in the GTA, Ottawa and Halifax-Dartmouth.
With new listings having improved more than sales, the national sales-to-new listings ratio eased to 54.2% from 54.9% in February. This measure of market balance has largely remained close to its long-term average of 53.5% since early 2018.
Considering the degree and duration to which market balance readings are above or below their long-term averages is the best way of gauging whether local housing market conditions favour buyers or sellers. Market balance measures that are within one standard deviation of their long-term average are generally consistent with balanced market conditions.
Based on a comparison of the sales-to-new listings ratio with the long-term average, two-thirds of all local markets were in balanced market territory in March 2019.
The number of months of inventory is another important measure of the balance between sales and the supply of listings. It represents how long it would take to liquidate current inventories at the current rate of sales activity.
There were 5.6 months of inventory on a national basis at the end of March 2019, in line with the February reading and one of the highest levels for the measure in the last three-and-a-half-years. Still, it is only slightly above its long-term average of 5.3 months.
Housing market balance varies significantly by region. The number of months of inventory has swollen far above its long-term average in Prairie provinces and Newfoundland & Labrador; as a result, homebuyers there have an ample choice of listings available for purchase. By contrast, the measure remains well below its long-term average in Ontario and the Maritime provinces.
The Aggregate Composite MLS® Home Price Index (MLS® HPI) declined by 0.5% y-o-y in March 2019. It last posted a y-o-y decline of similar magnitude in September 2009. (Chart B)

Among benchmark property categories tracked by the index, apartment units were the only one to post a y-o-y price gain in March 2019 (+1.1%), while townhouse/row unit prices were little changed from March 2018 (-0.2%). By comparison, one and two-storey single-family home prices were down by 1.8% and 0.8% y-o-y respectively.
As of this release, the MLS® HPI now includes home sales via Okanagan-Mainline Real Estate Board’s MLS® System, which covers communities in the Okanagan Valley from Revelstoke to the Peachland region.
Trends continue to vary widely among the 18 housing markets tracked by the MLS® HPI. Results remain mixed in British Columbia, with prices down on a y-o-y basis in Greater Vancouver (-7.7%) and the Fraser Valley (-3.9%). Prices also dipped slightly below year-ago levels in the Okanagan Valley (-0.8%). By contrast, prices rose by 1% in Victoria and by 6.4% elsewhere on Vancouver Island.
Among Greater Golden Horseshoe housing markets tracked by the index, MLS® HPI benchmark home prices were up from year-ago levels in Guelph (+6.6%), the Niagara Region (+6.0%), Hamilton-Burlington (+3.7%) the GTA (+2.6%) and Oakville-Milton (+2.3%). By contrast, home prices in Barrie and District held below year-ago levels (-6.1%).
Across the Prairies, supply remains historically elevated relative to sales and home prices remain below year-ago levels. Benchmark prices were down by 4.9% in Calgary, 4.4% in Edmonton, 4.6% in Regina and 2.7% in Saskatoon. The home pricing environment will likely remain weak in these cities until demand and supply become more balanced.
Home prices rose 7.6% y-o-y in Ottawa (led by a 10.4% increase in townhouse/row unit prices), 6.3% in Greater Montreal (led by an 8.1% increase in apartment unit prices) and 2.1% in Greater Moncton (led by a 12.9% increase in apartment unit prices). (Table 1)
The MLS® HPI provides the best way to gauge price trends, as averages are strongly distorted by changes in the mix of sales activity from one month to the next.
The actual (not seasonally adjusted) national average price for homes sold in March 2019 was $481,745, down 1.8% from the same month in 2018.
The national average price is heavily skewed by sales in Greater Vancouver and the GTA, two of Canada’s most active and expensive markets. Excluding these two markets from calculations cuts close to $100,000 from the national average price, trimming it to just under $383,000.
Provided by: CREA
The British Columbia Real Estate Association (BCREA) reports that a total of 5,707 residential unit sales were recorded by the Multiple Listing Service® (MLS®) in March, a decline of 23 per cent from the same month last year. The average MLS® residential price in the province was $687,720, a decline of 5.4 per cent from March 2018. Total sales dollar volume was $3.9 billion, a 27.1 per cent decline from the same month last year. “BC home sales continue to be adversely impacted by federal mortgage policy,” said BCREA Chief Economist Cameron Muir. “The erosion of affordability caused by the B20 stress test has created near recession level housing demand despite the province boasting the lowest unemployment rates in a decade.”
“The sharp erosion of affordability caused by the B20 stress test is now creating pent-up demand, as many would-be home buyers are forced to wait on the sidelines,” added Muir. “Unfortunately, new home construction is slowing as well, which will likely lead to another housing supply crunch down the road.”
Total MLS® residential active listings increased 36.2 per cent to 34,295 units compared to the same month last year. The ratio of sales to active residential listings declined from 29.4 per cent to 16.6 per cent over the same period.
Provided by: BCREA
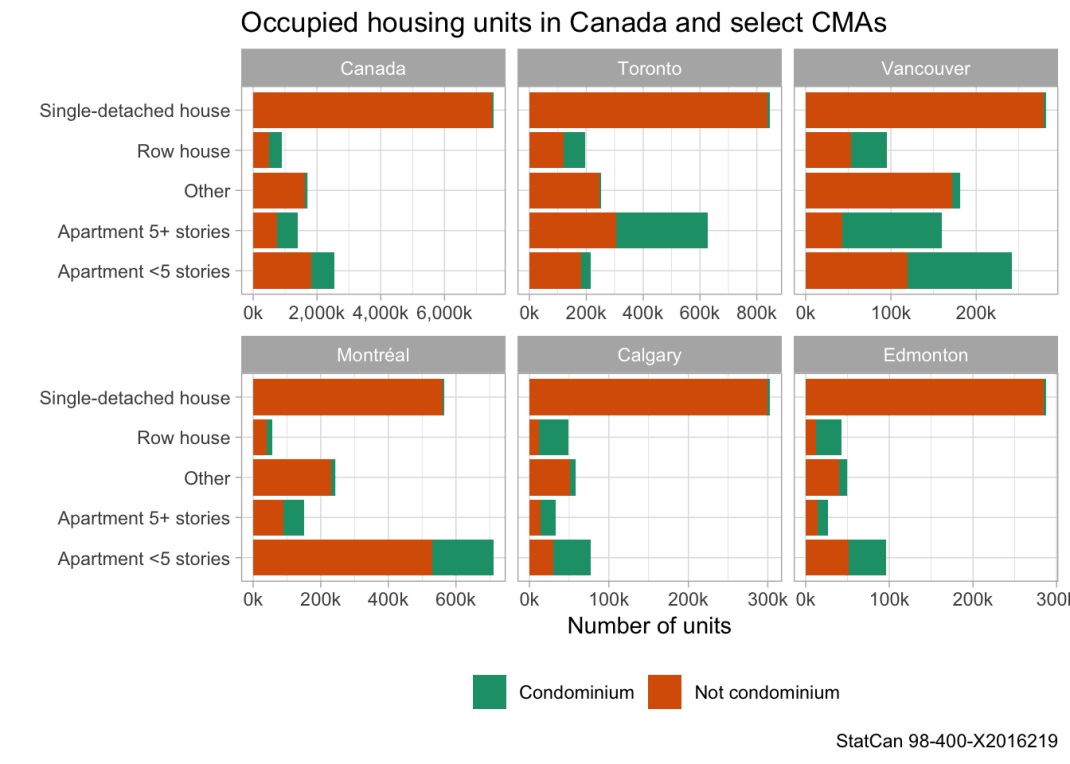
Jens von Bergmann (data analyst and mathematician); Nathanael Lauster (sociologist); and Douglas Harris (law professor) have been working since 2018 on a study of how condominiums are used and occupied across Canada. The goal is to use the results to better inform public and academic debate.
They recently presented some of their early findings at the National Housing Conference in Ottawa and have since made that information public. It is still a work in progress, but already there are some interesting takeaways. To start, here is a chart showing occupied housing units in Canada and in select CMAs:
Not surprisingly, Canada is broadly speaking a nation of single-detached houses. But in our three largest cities — Toronto, Montreal, and Vancouver — apartments/condominiums are doing a lot of the heavy lifting.
Vancouver has the highest proportion of condominiums. It is a geographically constrained metro area and it is one of the first cities in the country to adopt condominiums as a housing tenure. And in Montreal, there are more apartments under 5 storeys than there are single-detached houses. Not surprising. There’s no “missing middle” in this city.
But the really interesting question is, how are these condominiums being used and occupied? It’s a challenging question to answer, which is why it’s so often debated, but here’s what the researchers have found so far:

The owner and renter categories are self-explanatory. Temporary, which is the least common type of tenure, is where the owner has declared their principal residence as being somewhere else. In other words, the condominium is a second home.
The vacant category is effectively that city’s condominium rental vacancy rate. These are condominium units which are empty, but that are at the same time listed for rent. There are relatively few of these. In Toronto and Vancouver they’re virtually non-existent in this dataset (2016).
Finally, we get to unoccupied units. This one is tricky and the researchers aren’t exactly clear on what is driving this number. They chalk it up, at least partially, to the flexible nature of condominiums. For example, it could be empty because the unit is switching from owner-occupied to rental, or vice versa.
That said, it is very interesting to note that Toronto and Vancouver actually have the lowest percentage of unoccupied condominium units. This may be surprising to some of you given the public discourse around investor units in these two cities.
Generally, they found that in Canada’s three largest metro areas, the following rule of thumb seems to apply: For every 10 condominium units built, 6 will become owner-occupied, 3 will enter the rental stock, and 1 will go unoccupied. Does that seem right to you?
If you’d like to dig into the methodology that the researchers used, you can do that over here at Mountain Doodles. All of the charts and data used in this post were taken from there.
Provided by: Brandon Donnelly

Single Level Duplex Style
End Unit with Updates
Open Sun April 7, 2 - 4 pm
Price at $774,800
Metro Vancouver* home sales dipped to the lowest levels seen in March in more than three decades.
The Real Estate Board of Greater Vancouver (REBGV) reports that residential home sales in the region totalled 1,727 in March 2019, a 31.4 per cent decrease from the 2,517 sales recorded in March 2018, and a 16.4 per cent increase from the 1,484 homes sold in February 2019.
Last month’s sales were 46.3 per cent below the 10-year March sales average and was the lowest total for the month since 1986.
"Housing demand today isn’t aligning with our growing economy and low unemployment rates. The market trends we’re seeing are largely policy induced," Ashley Smith, REBGV president said. "For three years, governments at all levels have imposed new taxes and borrowing requirements on to the housing market.”
“What policymakers are failing to recognize is that demand-side measures don’t eliminate demand, they sideline potential home buyers in the short term. That demand is ultimately satisfied down the line because shelter needs don’t go away. Using public policy to delay local demand in the housing market just feeds disruptive cycles that have been so well-documented in our region."
There were 4,949 detached, attached and apartment properties newly listed for sale on the Multiple Listing Service® (MLS®) in Metro Vancouver in March 2019. This represents an 11.2 per cent increase compared to the 4,450 homes listed in March 2018 and a 27.2 per cent increase compared to February 2019 when 3,892 homes were listed.
The total number of homes currently listed for sale on the MLS® system in Metro Vancouver is 12,774, a 52.4 per cent increase compared to March 2018 (8,380) and a 10.2 per cent increase compared to February 2019 (11,590).
For all property types, the sales-to-active listings ratio for March 2019 is 13.5 per cent. By property type, the ratio is 9.4 per cent for detached homes, 15.9 per cent for townhomes, and 17.2 per cent for apartments.
Generally, analysts say downward pressure on home prices occurs when the ratio dips below 12 per cent for a sustained period, while home prices often experience upward pressure when it surpasses 20 per cent over several months.
The MLS® Home Price Index composite benchmark price for all residential properties in Metro Vancouver is currently $1,011,200. This represents a 7.7 per cent decrease from March 2018, and a 0.5 per cent decrease compared to February 2019.
Sales of detached homes in March 2019 reached 529, a 26.7 per cent decrease from the 722 sales in March 2018. The benchmark price for a detached home is $1,437,100. This represents a 10.5 per cent decrease from March 2018, and a 0.4 per cent decrease compared to February 2019.
Sales of apartment homes reached 873 in March 2019, a 35.3 per cent decrease compared to the 1,349 sales in March 2018. The benchmark price of an apartment property is $656,900. This represents a 5.9 per cent decrease from March 2018, and a 0.5 per cent decrease compared to February 2019.
Attached home sales in March 2019 totalled 325, a 27.1 per cent decrease compared to the 446 sales in March 2018. The benchmark price of an attached home is $783,600. This represents a six per cent decrease from March 2018, and a 0.7 per cent decrease compared to February 2019.
Provided by: REBGV

Gorgeous Loft Style Home
3bed, 2 bath 1815sqft
Open: April 6 from 1 to 3
Price at $1,098,800
Love at first sight! Featured in Western Living & Dwell on Design this elegant Eco-friendly 3bed/2bath/1815sqft loft home will leave you breathless. Origin by Port Development, designed by GBL Architect, is located in the heart of UniverCity; stones throw to all amenities. Features: 25'+ soaring ceilings, full height windows, an abundance of Southern light, wood & tile flooring, a gourmet kitchen w/12' island & hi-end SS apps & eating area, 2 balconies, 2 bedrms, 4 pc bath & functional laundry rm complete the main level. The loft offers 13' ceilings, an envious walk-in closet, stunning spa-inspired 3pc bath & private balcony. Bonus: in floor radiant heat, 2 parking stalls, private locker room & more. Act Now! Open Apr 6 - 1 to 3.
Call 604-377-3689 or Email me today and let's discuss your next home sale or purchase.