RSS

Just Sold: 1551 Manning Ave., Port Coquitlam, Glenwood PQ


Move-in ready home on large 8,052sf lot with potential future development. This property screams pride of ownership and is move in ready. Upper floor features real hardwood flooring, gas fireplace, spacious kitchen and eating area plus 3 spacious bedrooms and 2 bathrooms. Lower level offers rec room with wet bar + 1 bed mortgage helper with seperate entrance. The backyard features a private oases with stamped concrete finishes, and hot tub with covered gazebo. Detached garage/workshop off back lane + front driveway. Property is designated for potential townhome development. Inquire with the city for more details.


Listing Offered By: Royal LePage West R.E.S.

Read

Metro Vancouver real estate sales, prices to climb in 2021: Central 1

Central 1 Credit Union is forecasting a recovery for Metro Vancouver and B.C.'s real estate market


A new report from Central 1 Credit Union suggests Metro Vancouver’s housing market could be bouncing back faster than anticipated.


The institution’s 2019-2021 B.C. Resale Market Housing Outlook said demand is picking up once again after the 2018 real estate slowdown, amid lower mortgage rates and continued population growth.
 

“Home sales have returned to more normal levels following over a year of policy-induced declines but B.C.’s sales recovery has lagged the rest of Canada,” according to Central 1 deputy chief economist Bryan Yu.


Yu said a decline in prices, particularly in the Lower Mainland, has also helped attract buyers back to the market.


“A growing number of buyers in the region have idled on the sidelines waiting for improvements in affordability following mortgage stress tests,” according to the report.


“Significant price declines over the past year and lower borrowing costs have buyers returning to the market among all housing types, particularly in the lower priced condominium sector.”


Province-wide, Yu said he anticipates 2019 to finish with a seven per cent drop in residential resale transactions, but forecasts a 13 per cent increase in 2020, followed by another four per cent hike in 2021.
 

Along with an increase in sales activity, Central 1 is forecasting a return to climbing prices.


The institution said prices could increase by 3.8 per cent next year and a further four per cent in 2021.


“Metro Vancouver will lead this increase which will undoubtedly bring affordability challenges back into the spotlight,” said Yu.


Yu said despite the slowdown, housing starts in B.C. were not seriously affected by the real estate downturn, with about 44,000 anticipated by year’s end.


However, it said many of the projects were pre-sold during the stronger market, and that new starts were expected to trend downward in 2020 amid slower pre-sale activity.


The report also predicted ongoing tightness in the rental market.


The Central 1 report reflects a growing consensus that the province’s housing market is rebounding after a slump that hit the Lower Mainland particularly hard.


Last month, the Canada Mortgage and Housing Corporation (CMHC) released a report predicting sales and prices in B.C. would begin to stabilize in 2020 and accelerate in 2021.


The CMHC forecast suggested B.C.’s real estate market would out-perform the rest of Canada.


“British Columbia will see modest recovery in price growth in 2020 from a decline in 2019, but rise to the second-highest rate of price growth after Ontario in 2021,” stated the report.


Earlier in November, the Real Estate Board of Greater Vancouver reported an uptick in regional sales for the fourth consecutive month.


The organization said October sales activity had climbed to nearly 10 per cent above the 10-year sales average for the month.


It also found that while prices in the region were still down year-over-year, they had held steady month-to-month after more than a year of regular monthly declines.


The benchmark price for a detached home across the Lower Mainland was $1,410,500, down 7.5 per cent from October 2018, but up 0.3 per cent from September, according the board.


The benchmark price of an apartment across the region was $652,500, down 5.9 per cent from October 2018, but up 0.2 per cent from September.


Provided by: Simon Little for the Global News


Read

Vancouver's empty homes tax should not be increased beyond its current rate in order to ensure people keep paying it, a city staff report states.


While the report, which will be presented to city council on Tuesday, said further exemptions for second homes should not go ahead, staff do recommend further exemptions to homes under renovation.


The tax applies a one per cent levy on a home's assessed value if owners cannot prove they occupy the property for more than six months of the year, either themselves or with renters.

The report comes after a review of the tax was ordered by council earlier this year to study the policy's effects on the housing market and its overall fairness.


Questions about raising the tax rate popped up during the most recent municipal election, with then-candidate Kennedy Stewart vowing to raise it up to three per cent. Stewart continued to pursue the idea after winning the election.


But staff say raising the tax rate would risk non-compliance, particularly among homeowners who are also subject to the province's speculation tax.


"Housing policy and tax experts engaged by staff during the review expressed strong concern about the potential for an increase in the tax rate to incentivize non compliance and avoidance," the report states.


Instead, those experts called for stricter penalties for not paying the tax, which staff said they intend to review with the province.


Some exemptions exist for the tax, including properties under renovation, property transfer, and strata rental restrictions.


While staff rejected a proposed exemption for second homes that are used part time through the year, the report does suggest further exemptions for renovated properties.


The proposed amendment would add together the tenancy time and the amount of time spent qualifying for permits to renovate or redevelop properties, after the city heard complaints from owners about being charged the tax while waiting for permits to be approved by the city.


READ MORE: Vancouver collects $21M from empty homes tax, expects $38M total for first year 


That sticking point formed the basis of one of several lawsuits launched this year against the city over the tax.

Overall, staff say the tax has been effective in its goal of adding more homes to the rental market and generating revenue for the city to put towards affordable housing projects.


The latest data shows the city collected $39.4 million in revenue during the 2018 tax year from the owners of 1,989 vacant properties.


READ MORE: City of Vancouver facing multiple lawsuits over empty homes tax 


That's more money from less properties than in 2017, when 2,538 homes generated $38 million in revenue.

An extra $22.1 million was collected from non-compliance audits on 892 properties.


In addition to the drop in vacant properties, the city found the number of properties tenanted went up by seven per cent from 2017 to 2018, from 46,770 to 50,102.


"At this point, based on consultation with tax experts, housing experts, the public, and other stakeholders, the tax is working mostly as intended and minimal further amendments are recommended at this time," the report states.


"The data also supports this conclusion with key indicators showing trends that point to the tax working to encourage occupancy."


Provided by: Sean Boynton for Global News

Photo: © Darryl Dyck/CP 


Read

Just Sold: 307 501 Cochrane Ave., Coquitlam, Coquitlam West

Large 2 Bed Corner Home

Bright & Open Layout

Price at $568,800


Click here for more...


Top floor, corner unit with an abundance of natural light. "KILLER" location! Oh, and ripe for re-development! Your search ends here. This North & East facing top floor 2 bed, 2 bath, 1145sqft home offers stunning vaulted ceilings, laminate floors throughout, open living/dining rooms, spacious kitchen with plenty of cupboard & counter space, in suite storage & a cozy gas F/P. The huge master has pass through closest and 3-piece ensuite and the second bedroom is well sized. Bonus: parking and locker. Located in the heart of Burnaby/Coquitlam boarder, stone’s throw to: transit, Skytrain, shopping, recreation, schools and every amenity you can think of. Act Now!

Read

Just Listed: 202 501 Cochrane Ave., Coquitlam, Coquitlam West

Awesome Central Location

Almost 1000 SQFT

Open: Nov 23 from 1 to 3

Price at $549,900


Click here for more...


HOT DEAL ALERT! "KILLER" location! Fantastic layout! Oh, and ripe for re-development! Have we got your attention yet? This bright, west facing, 2 bed, 1 bath, 996sqft home will not disappoint Features: brand new bedroom carpets, laminate floors in living & dining areas, open living/dining rooms, kitchen with SS appliances & plenty of cupboard & counter space, in suite storage & a cozy gas F/P. The larger master has excellent closet space and the second bedroom is well sized. Bonus: parking and locker. Located in the heart of Burnaby/Coquitlam boarder, stone’s throw to: transit, Skytrain, shopping, recreation, schools and every amenity you can think of. Act Now! Open Sat Nov 23 from 1 to 3.

Read

NEW PRICE: 407 Draycott St., Coquitlam, Central Coquitlam


Prime, level lot in Central Coquitlam

Price at $1,199,000


Click here for more...


Located in a quiet family friendly neighborhood with no through traffic. This 7840sqft corner lot measuring approximately 80' X 98' offers lane access and City views. Potentially a livable home with renovations. Massive detached workshop for all your toys, tools and storage needs. Ideally suited for a developer or someone looking to build their dream home.  Drive by anytime. Call now for more details.

Read

Canadian home sales hold steady in October

Statistics released today by the Canadian Real Estate Association (CREA) show national home sales were unchanged from September to October 2019.


Highlights:

  • National home sales held steady on a month-over-month (m-o-m) basis in October.
  • Actual (not seasonally adjusted) activity was up 12.9% year-over-year (y-o-y).
  • The number of newly listed properties declined by 1.8% m-o-m.
  • The MLS® Home Price Index (HPI) advanced by 0.6% m-o-m and 1.8% y-o-y.
  • The actual (not seasonally adjusted) national average sale price climbed 5.8% y-o-y.

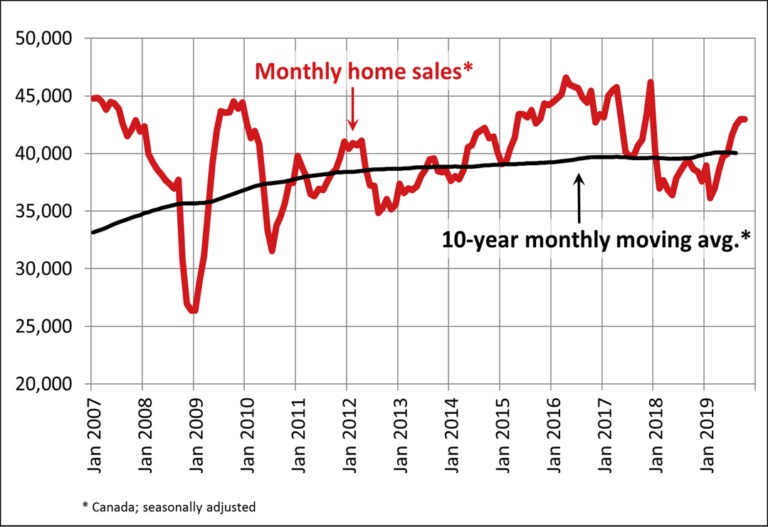
Home sales recorded via Canadian MLS® Systems remained steady in October 2019 following a string of monthly increases that began in March. Activity is now almost 20% above the six-year low reached in February 2019 but remains 7% below heights reached in 2016 and 2017. (Chart A)


There was an almost even split between the number of local markets where activity rose and those where it declined. Higher sales in Greater Vancouver (GVA), the neighbouring Fraser Valley and Ottawa offset a monthly decline in activity in the Greater Toronto Area (GTA)—particularly in Central Toronto—and Hamilton-Burlington.


Actual (not seasonally adjusted) activity rose 12.9% year-over-year. Transactions were up from year-ago levels in 80% of all local markets in October, including all of Canada’s largest urban markets.


“Steady national activity in October hides how the mortgage stress-test remains a drag on many local housing markets where the balance between supply and demand favours homebuyers in purchase negotiations,” said Jason Stephen, president of CREA. “That said, all real estate is local, so market balance varies depending on location, housing type, and price segment. Nobody knows that better than a professional REALTOR®, your best source for information and guidance when negotiating the sale or purchase of a home,” said Stephen.


“It’s a full-blown buyer’s market or on the cusp of one in a number of housing markets across the Prairies and in Newfoundland,” said Gregory Klump, CREA’s Chief Economist. “Homebuyers there have the upper hand in purchase negotiations and the mortgage stress-test has contributed to that by reducing the number of competing buyers who can qualify for mortgage financing while market conditions are in their favour.”


The number of newly listed homes fell by 1.8% in October, with the GTA and Ottawa posting the largest declines. Almost a third of all housing markets posted a monthly decline of at least 5%, while about a fifth of all markets posted a monthly increase of at least 5%.


Steady sales and fewer new listings further tightened the national sales-to-new listings ratio to 63.7%. This measure has been increasingly rising above its long-term average of 53.6%. Its current reading suggests that sales negotiations are becoming increasingly tilted in favour of sellers; however, the national measure continues to mask significant regional variations.


Considering the degree and duration to which market balance readings are above or below their long-term averages is the best way of gauging whether local housing market conditions favour buyers or sellers. Market balance measures that are within one standard deviation of their long-term average are generally consistent with balanced market conditions.


Based on a comparison of the sales-to-new listings ratio with the long-term average, just over two-thirds of all local markets were in balanced market territory in October 2019, including the GTA and Lower Mainland of British Columbia. Nonetheless, sales negotiations remain tilted in favour of buyers in housing markets located in Alberta, Saskatchewan and Newfoundland & Labrador.


The number of months of inventory is another important measure of the balance between sales and the supply of listings. It represents how long it would take to liquidate current inventories at the current rate of sales activity.


There were 4.4 months of inventory on a national basis at the end of October 2019—the lowest level recorded since April 2017. This measure of market balance has been retreating further below its long-term average of 5.3 months. While still within balanced market territory, its current reading suggests that sales negotiations are becoming increasingly tilted in favour of sellers.


National measures of market balance continue to mask significant regional variations. The number of months of inventory has swollen far beyond long-term averages in Prairie provinces and Newfoundland & Labrador, giving homebuyers ample choice in these regions. By contrast, the measure is running well below long-term averages in Ontario, Quebec and Maritime provinces, resulting in increased competition among buyers for listings and providing fertile ground for price gains. The measure is still well centred within balanced market territory in the Lower Mainland of British Columbia.


The Aggregate Composite MLS® Home Price Index (MLS® HPI) rose 0.6%, marking its fifth consecutive monthly gain. (Chart B)


Seasonally adjusted MLS® HPI readings in October were up from the previous month in 14 of the 18 markets tracked by the index. (Table 1)


Recently, home price trends have generally been stabilizing in the Lower Mainland and the Prairies. While that remains the case in Calgary and Saskatoon, home prices in Edmonton and Regina have moved lower. By contrast, home price trends have started to recover in the GVA and the neighbouring Fraser Valley.


Meanwhile, price growth continues to rebound in the Greater Golden Horseshoe (GGH). In markets further east, price growth has been trending higher for the last three or four years.


Comparing home prices to year-ago levels yields considerable variations across the country, with mostly declines in western Canada and mostly price gains in eastern Canada.


The actual (not seasonally adjusted) Aggregate Composite MLS® (HPI) was up 1.8% y-o-y in October 2019, the biggest year-over-year gain since November 2018.


Home prices in the GVA (-6.4%) and the Fraser Valley (-4.2%) are still below year-ago levels, although declines are becoming smaller.


Elsewhere in British Columbia, home prices logged y-o-y increases on Vancouver Island and in the Okanagan Valley (3.1% and 2%, respectively) while having edged marginally higher in Victoria (0.5% y-o-y).


Calgary, Edmonton and Saskatoon posted price declines in the range of -1.5% to -2.5% on a y-o-y basis in October, while the gap between this year and last year widened sharply to -6.8% in Regina.


In Ontario, price growth has re-accelerated well ahead of overall consumer price inflation across most of the GGH. Meanwhile, price growth in recent years has continued uninterrupted in Ottawa, Montreal and Moncton.


All benchmark home categories tracked by the index remained in positive y-o-y territory in October 2019. Two-storey single-family home prices were up most, rising 2.5% y-o-y. One-storey single family home prices rose 1.4% y-o-y, while townhouse/row and apartment units climbed by 1% and 1.2%, respectively.


The MLS® HPI provides the best way to gauge price trends, because averages are strongly distorted by changes in the mix of sales activity from one month to the next.


The actual (not seasonally adjusted) national average price for homes sold in October 2019 was around $525,000, up 5.8% from the same month last year.


The national average price is heavily skewed by sales in the GVA and GTA, two of Canada’s most active and expensive housing markets. Excluding these two markets from calculations cuts almost $125,000 from the national average price, trimming it to around $400,000 and reducing the year-over-year gain to 4.7%.


Provided by: CREA

Read

Just Listed: 307 501 Cochrane Ave.,Coquitlam, Coquitlam West


Large 2 Bed Corner Home

Bright & Open Layout

Price at $568,800


Click here for more...


Top floor, corner unit with an abundance of natural light. "KILLER" location! Oh, and ripe for re-development! Your search ends here. This North & East facing top floor 2 bed, 2 bath, 1145sqft home offers stunning vaulted ceilings, laminate floors throughout, open living/dining rooms, spacious kitchen with plenty of cupboard & counter space, in suite storage & a cozy gas F/P. The huge master has pass through closest and 3-piece ensuite and the second bedroom is well sized. Bonus: parking and locker. Located in the heart of Burnaby/Coquitlam boarder, stone’s throw to: transit, Skytrain, shopping, recreation, schools and every amenity you can think of. Act Now!
Read

BC Homes Sales Carry Momentum into 2020

BCREA 2019 Fourth Quarter Housing Forecast


After a slow start to 2019, MLS® home sales in BC have embarked on a sustained upward trend since the spring. Slower BC economic growth and headwinds emanating from the South, along with the dampening effects of federal mortgage rules and provincial tax policy, mean that home sales are simply returning to trend after sustaining a significant shock, rather than returning to the heights of recent years.


Despite the significant improvement in market activity, sluggishness out of the gate will likely mean that provincial MLS® sales decline for a third consecutive year in 2019 to 77,100 unit sales. However, we expect all markets across BC to post rising sales in 2020 with total provincial MLS® sales up 10.9 per cent to their long-run average of about 85,500 units. As demand normalizes, the accumulation of resale inventory has reversed course in many markets around BC. We anticipate that this trend will continue in 2020 with sales and listings finding balance. For most markets this will mean price growth that’s in-line with inflation, though for some supply-constrained areas we are forecasting strong price growth. This is particularly true in the parts of Northern BC most directly impacted by massive LNG Canada investment. After a projected 2 per cent decline in the provincial MLS® average price in 2019, we anticipate a rise of 3.6 per cent in 2020.


Unexpectedly strong new home construction activity continued in 2019, particularly in Metro Vancouver. Total provincial housing starts are forecast to rise close to 8 per cent this year, surpassing the 40,000-unit mark for a third consecutive year and reaching a record high of 44,000 total starts. That elevated pace of new home construction adds to an already large pipeline of homes under construction. The overwhelming majority of those units are apartments, which have long and variable completion times. However, as this supply is added to the market, future price growth will likely be constrained.


Click here for the full forecast...


Provided by: BCREA

“Copyright British Columbia Real Estate Association. Reprinted with permission.” 


Read

Just Sold: 1701 7368 Sandbourne Ave., Burnaby, South Slopes


Gorgeous, Endless Views

Spacious 1234sqft Home

Price at $668,800


Click here for more...


Stunning 270-degree endless Water, City Light & Mountain views from every room. Located on the 17th story of the popular concrete Mayfair Place complex in desirable City in a Park neighborhood of Burnaby's South Slopes. Your search ends here. A blank slate is calling your inner designer to add your personal touch. This 2bed/2bath/1234sqft home offers 9' ceilings throughout, a spacious layout, an abundance light, living/dining rooms & separate family/eating areas, 2 balconies & gas F/P. The huge master has pass-through closets & 5pc ensuite. Bonus: 2 parking stalls & locker. Enjoy well-appointed building amenities including indoor pool & gym. A location to beat, close to shopping, recreation, schools, Skytrain, transit & so much more. Act Now! 
Read

THANKS To My Clients
Another sincere thank you to all of my clients that have placed their trust in me to assist them with their real estate needs. I am Proud to be part of the Royal LePage West Real Estate Services team and congrats to my fellow realtors. 
Read

Just Listed: 407 Draycott St., Coquitlam, Central Coquitlam

Prime, level lot in Central Coquitlam

Price at $1,199,000


Click here for more...


Located in a quiet family friendly neighborhood with no through traffic. This 7840sqft corner lot measuring approximately 80' X 98' offers lane access and City views. Potentially a livable home with renovations. Massive detached workshop for all your toys, tools and storage needs. Ideally suited for a developer or someone looking to build their dream home.  Drive by anytime. Call now for more details.

Read
Reciprocity Logo The data relating to real estate on this website comes in part from the MLS® Reciprocity program of either the Greater Vancouver REALTORS® (GVR), the Fraser Valley Real Estate Board (FVREB) or the Chilliwack and District Real Estate Board (CADREB). Real estate listings held by participating real estate firms are marked with the MLS® logo and detailed information about the listing includes the name of the listing agent. This representation is based in whole or part on data generated by either the GVR, the FVREB or the CADREB which assumes no responsibility for its accuracy. The materials contained on this page may not be reproduced without the express written consent of either the GVR, the FVREB or the CADREB.