RSS

Just Sold: 107 525 Foster Ave., Coquitlam, Coquitlam West


2 bedroom, 2 bathroom unit in the amazing Lougheed Heights 2! This amazing ground floor unit has the bonus of a very large patio of 453 sq ft for you to enjoy your days on & is a great entertainment space! An open floor plan with the 2 bedrooms & bathrooms on opposite sides of the unit for the best use of space! The master bedroom has a his & her closets & a lovely ensuite with his & her sinks! The second bedroom has a cheater door to the second bathroom for the easiest access. The unit is fully equipped with stainless steel appliances, beautiful cabinets & insuite laundry. The unit also comes with 1 parking spot & 1 locker! Lougheed Heights is centrally located near both Burquitlam & Lougheed Skytrain Station, SFU, Lougheed Mall, Supermarkets, restaurants/bars & more!


Listing Offered by: Sutton Group-West Coast Realty

Read

Just Sold: 59 8844 208 St., Langley, Walnut Grove


Mayberry! Great complex! Great location! Charming 3 bdrm townhome right in the heart of Walnut Grove - just blocks from schools, rec centre, shopping & gorgeous hiking trails accessed from the complex. Updates & features include - new quality laminate thru-out main & carpet on stairs & up, stainless steel appliances, modern paint colours, new toilets, hot water tank (4 yrs), gas fireplace, quaint patio & yard off kitchen/eating area. Cheater ensuite with soaker tub, separate shower, double sinks & a skylight. 38' deep tandem 2 car garage with loads of storage area/fitness eqpt/work shop. Very quiet location. Great family complex and no size restriction on dogs.


Listing Offered by: Sutton Group - West Coast Realty Abbotsford

Read

Just Listed: 478 Mundy, Coquitlam, Central Coquitlam
Luxury living at its finest. Top to bottom, in/out no expense spared. This 8bed/10bath/3-car garage/7136sqft home sits on a 9600sqft West facing level lot w/lane access in desirable Central Coquitlam. Features: over height ceilings on every floor, Control4 automation, 10 zone radiant heat, AC, LoE 366 windows, 8 camera sec, Miele appliance package, spice kitchen, guest bed on main floor, 1 bed legal suite, nanny quarters, media room, built-in speakers throughout & much more. The stunning great room has 20' ceilings, floor to ceiling tile wall, 60" F/P & direct yard access. Enjoy summer nights on the covered deck complete w/infra red heaters & speakers. Indulge in an 800sqft master suite w/spa inspired ensuite, soaker tub & oversized shower. All this and a location that can't be beat!
Read

On Monday, the Canadian Real Estate Association (CREA) released its national housing statistics for the month of May—the second full month of the COVID-19 pandemic. 

While restrictions have begun to lift in many parts of the country, much remains uncertain about the real estate industry. Below, CREA’s Senior Economist Shaun Cathcart provides an update on the current state of housing markets in Canada and explains what the data means for members.


May was one of those “on the one hand … on the other hand” kind of months for housing data in Canada. 

On the one hand, both sales and new listings were up on a seasonally adjusted basis in May compared to April—57% for sales and 69% for new listings—huge percentage increases, albeit from a very low starting point.

On the other hand, sales and new listings are still historically very low at this point.

To give you an idea of where sales are in level terms, if a normal solid year sees about 500,000 homes trade hands via MLS® Systems in Canada, the annualized pace of sales in April was only about 200,000, but May was almost 315,000.

So, the big picture for this data release is things are clearly moving in the right direction, probably faster than many of us would have guessed, but normal is still a ways away.

Interestingly, under the surface what those monthly numbers miss is this improving trend has been going on since mid-April and has continued right up through the first week of June. As such, we’re already closer (though not yet back) to normal than these monthly numbers suggest. The June numbers should show that.

Regionally, since we all reacted to the COVID-19 lockdowns in much the same way, these trends look similar everywhere. That is, a big drop off in sales and new listings in April and a partial rebound in May.

However, there are some notable regional differences.

Several places which saw smaller rebounds in May, also had much smaller declines in April. So, taken the size of the initial drop together with May’s rebound, a lot of the places with the less exciting looking numbers are a lot closer to being back to normal levels of activity than others. This is the case in Saskatchewan, Manitoba and New Brunswick.
 
Quebec is also doing relatively better, having seen a large decline in activity in April but also the largest rebound in May.

In contrast, British Columbia, Alberta and Ontario are currently the furthest below normal. To blame it all on demand may be putting the cart before the horse in this situation.

In some cases (particularly in Ontario), you must consider there may be supply side constraints pacing the sales rebound. Despite buyers being around and wanting to be active in the market, it might be taking a bit longer for those new listings to be made available for sale again. You can’t buy what isn’t available.

On the price side, the MLS® Home Price Index (HPI) was basically unchanged from April to May, with about half the markets covered seeing prices firm up. This is in line with sale-to-list price ratios which have also been rising again over the last month or so in many parts of the country.

Looking at prices across the country, since the COVID-19 crisis began small declines in prices have been seen in British Columbia while declining trends already in place in Alberta have accelerated a bit.

Further east across the Prairies, where sales have been doing comparatively much better against history than in much of the country, price trends have been stabilizing.

The Greater Golden Horseshoe in Ontario has generally seen its pre-COVID-19 rapidly accelerating prices put into a stall for now, although some of those markets are looking like they’re ready to pick up again.

And even further east in Ottawa, Montreal and Moncton, prices appear to have been able to continue climbing, albeit at a slower pace than before.

The overall MLS® HPI is still up 5.3% year-over-year.

The national average home price has admittedly taken a bit of a hit in the last two months, but for the most part that’s likely because the higher end of the market is currently less active. As of May 2020, the national share of home sales made up by British Columbia and Ontario (the two most expensive provinces by far) hit its lowest level on record. The national average price should recover as these parts of the sales sample return to more normal levels of activity.


Provided by: CREA

Read

Housing Market Activity Shows Signs of Recovery in May


The British Columbia Real Estate Association (BCREA) reports that a total of 4,518 residential unit sales were recorded by the Multiple Listing Service® (MLS®) in May 2020, a decline of 45.2 per cent from May 2019. The average MLS® residential price in BC was $728,898, a 3.2 per cent increase from $706,394 recorded the previous year. Total sales dollar volume in May was $3.3 billion, a 43.5 per cent decrease over 2019.


“There were encouraging signs of recovery in May,” said BCREA Chief Economist Brendon Ogmundson. “While activity is still far below normal, both sales and listings are up significantly from April’s lows.”


New listings activity started to normalize around the first week of May, reversing a slide in total active listings. However, active listings are still down close to 24 per cent year-over-year and are more than 10,000 listings below where they would normally be in the spring months.


Year-to-date, BC residential sales dollar volume was down 6 per cent to $18.6 billion, compared with the same period in 2019. Residential unit sales were down 14.2 per cent to 24,695 units, while the average MLS® residential price was up 9.6 per cent to $753,155.


Click here for more...


Provided by: BCREA

Read

Grateful In These Unprecedented Times


Grateful to all my clients that trusted me with your real estate needs during such an unprecedented time. Thank you.


Congratulations to my fellow Royal LePage West realtors! Looking forward to see what June has to offer!

Read

BC Homes Sales to Post Strong Recovery in 2021

Second Quarter – June 2020


Two years on from being buffeted by demandstifling government policies, the BC housing market was set to record a relatively normal year in 2020. However, hopes for a return to normal were upended by a worldwide pandemic that has thrown a blanket of uncertainty over the entire global economy.


With much of the economy at a standstill, and households and the real estate sector adhering to social distancing, activity in the housing market has slowed dramatically. Sales in the early spring fell to unprecedented lows and we anticipate that sales will remain below normal through the summer months.


However, as the economy “re-opens” and measures to mitigate the spread of COVID-19 are gradually eased, we expect home sales will start to rebound, aided by record-low mortgage rates and pent-up demand. We are forecasting that provincial MLS® sales will fall 21.3 per cent this year to 60,885 units before posting a strong recovery to 88,490 units in 2021.


The impact of the current pandemic and associated recession on prices is largely determined by the reaction of supply. If the inventory of listings accumulates significantly, and particularly if that inventory represents foreclosures or motivated selling by those impacted by rising unemployment, prices will be more severely impacted. However, given the unusual nature of COVID-19, the supply of listings for sale has declined for at least the first month of the pandemic. Even when social distancing measures ease and normal recession dynamics take over, the total supply of homes for sale will likely peak at a lower level than would be expected given the underlying economic turmoil.


A muted rise in for-sale inventory along with plummeting interest rates and pent-up demand may translate to home prices remaining relatively firm in 2020. We are forecasting the provincial MLS® average price to finish the year up 1.8 per cent and increase a further 5.6 per cent in 2021.


Click here for more...


Provided by: BCREA

“Copyright British Columbia Real Estate Association. Reprinted with permission.”

Read

Home prices remain steady, buyers and sellers become more comfortable operating in today’s market


Metro Vancouver* home prices have remained steady since provincial health officials implemented physical distancing requirements in March.


The Real Estate Board of Greater Vancouver (REBGV) reports that the MLS® Home Price Index1 composite benchmark price for all residential properties in Metro Vancouver today is $1,028,400. This is virtually unchanged from April 2020, a 1.4 per cent increase over the last three months, and a 2.9 per cent increase compared to May 2019.


"Home prices have been stable during the COVID-19 period," Colette Gerber, REBGV Chair said. "While we’re seeing a variety of long-term projections for the market, it's critical to understand the facts and trends as they emerge."


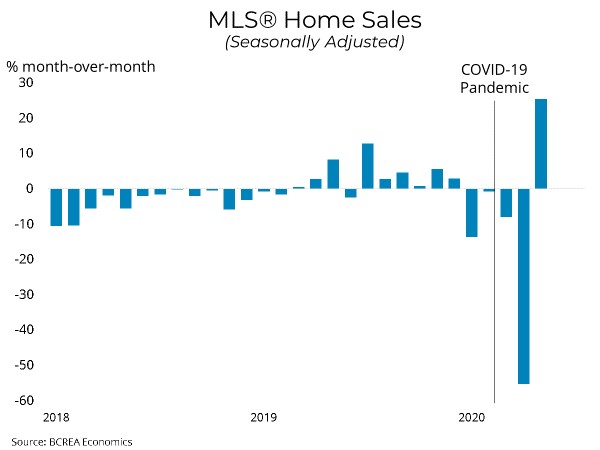
Residential home sales in the region totalled 1,485 in May 2020, a 43.7 per cent decrease from the 2,638 sales recorded in May 2019 and a 33.9 per cent increase from the 1,109 homes sold in April 2020.


Last month’s sales were 54.4 per cent below the 10-year May sales average. "Home sale and listing activity is down compared to typical, long-term levels and up compared to the activity we saw in April 2020," Gerber said.


"Home buyers and sellers are adapting today, becoming more comfortable operating with the physical distancing requirements that are in place in the market."


There were 3,684 detached, attached and apartment properties newly listed for sale on the Multiple Listing Service® (MLS®) in Metro Vancouver in May 2020. This represents a 37.1 per cent decrease compared to the 5,861 homes listed in May 2019 and a 59.3 per cent increase compared to April 2020 when 2,313 homes were listed.


"Home buyers and sellers are working with their REALTORS® to use new tools to complete different stages of the real estate transaction virtually," Gerber said. “When in-person interactions are necessary, we’re working with our clients to follow the physical distancing requirements set out by WorkSafeBC and the provincial health officer." The total number of homes currently listed for sale on the MLS® system in Metro Vancouver is 9,927, a 32.4 per cent decrease compared to May 2019 (14,685) and a 5.7 per cent increase compared to April 2020 (9,389).


For all housing types, the sales-to-active listings ratio for May 2020 is 15 per cent. By housing type, the ratio is 13.5 per cent for detached homes, 18.9 per cent for townhomes, and 14.8 per cent for apartments.


Generally, analysts say downward pressure on home prices occurs when the ratio dips below 12 per cent for a sustained period, while home prices often experience upward pressure when it surpasses 20 per cent over several months.


Sales and benchmark prices by property type


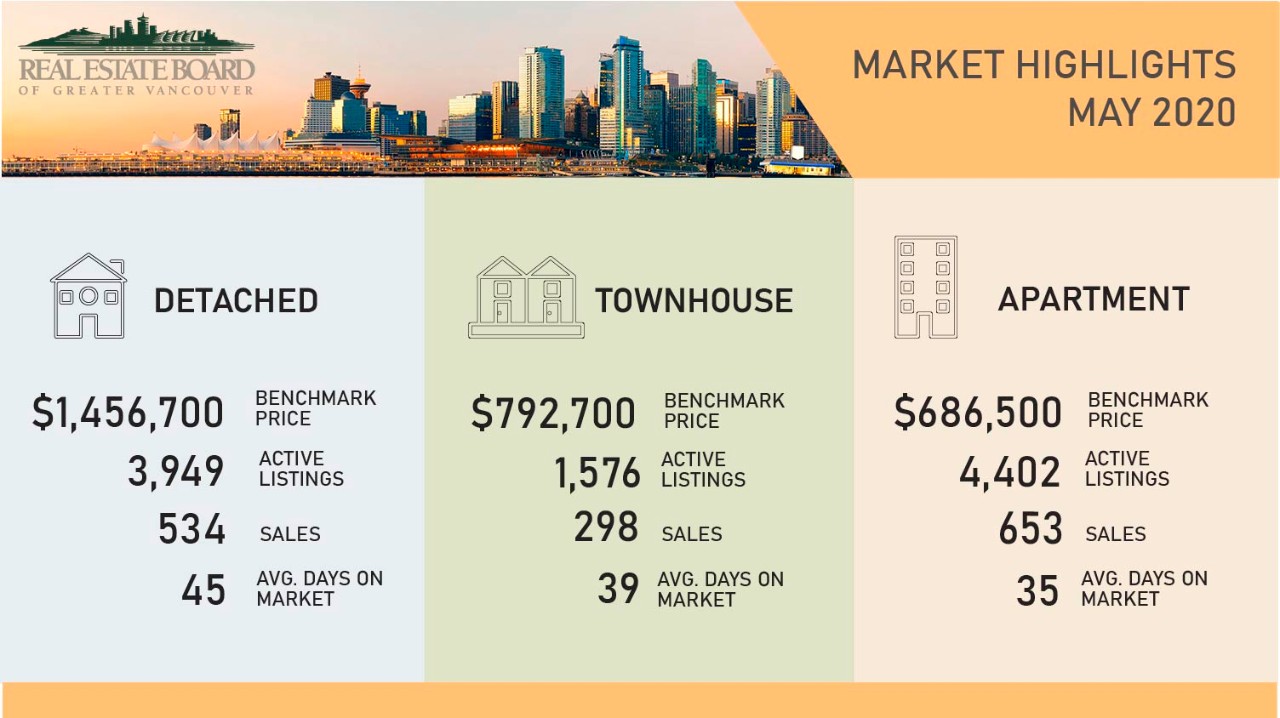
Sales of detached homes in May 2020 reached 534, a 41.5 per cent decrease from the 913 detached sales recorded in May 2019. The benchmark price for detached properties is $1,456,700. This is a 0.3 per cent increase from April 2020, a 2.2 per cent increase over the past three months, and a 2.9 per cent increase compared to May 2019.


Sales of apartment homes reached 653 in May 2020, a 47.6 per cent decrease compared to the 1,246 sales in May 2019. The benchmark price of an apartment home is $686,500. This is a 0.3 per cent decrease from April 2020, a 0.9 per cent increase over the past three months, and a three per cent increase compared to May 2019.


Attached home sales in May 2020 totalled 298, a 37.8 per cent decrease compared to the 479 sales in May 2019. The benchmark price of an attached home is $792,700. This is a 0.2 per cent increase from April 2020, a 1.2 per cent increase over the past three months, and a 1.8 per cent increase compared to May 2019.


Click here for more...


Provided by: REBGV

Read
Reciprocity Logo The data relating to real estate on this website comes in part from the MLS® Reciprocity program of either the Greater Vancouver REALTORS® (GVR), the Fraser Valley Real Estate Board (FVREB) or the Chilliwack and District Real Estate Board (CADREB). Real estate listings held by participating real estate firms are marked with the MLS® logo and detailed information about the listing includes the name of the listing agent. This representation is based in whole or part on data generated by either the GVR, the FVREB or the CADREB which assumes no responsibility for its accuracy. The materials contained on this page may not be reproduced without the express written consent of either the GVR, the FVREB or the CADREB.