RSS


I would like to say a big "thank you!" for your tireless hard work, your effective marketing methodology, and most importantly your abundance of professional experience and judgement. We also felt very well served throughout this process thanks to your transparent and timely communications. The fact that we negotiated both offers during the height of pandemic, particularly while you were under quarantine procedures, speaks volume how effective of a communicator you are. 


Through past encounters and dealings with you, be it the pony rides at the community carnivals or the quick but comforting help from the lawyer you referred I was never in doubt that you have indeed been the "friend in need". I am very happy to have had the opportunity to turn that loose friendship into a solid business partnership!


It's been a pure joy to work with you. We will definitely keep you at the very top of our list for our future real estate needs!


T. & S. T

Read

Just Listed: 102 9300 University Cr., Burnaby, Burnaby North, SFU

Two Level One University Home

Updated Throughout

4 bed, 3 bath, 1739sqft

Priced at $998,000


Click here for more...


Nestled in a gorgeous, forested outlook, this unique and amazing 4bed/3bath/1739sqft/2level home, located at One University Crescent, SFU's flagship development, will not disappoint! Features: freshly painted, new flooring throughout, over height ceilings on main lvl, expansive windows, open living & dining areas, update kitchen w/quartz counters, newer appls, tile backsplash, refaced cupboards & direct access to a massive partially covered patio. The large master has pass through closets & 5 pc ensuite. The 2nd & 3rd rooms are well sized. Down: 1bed suite w/separate entry, cooking area, laundry hook-up & patio; perfect mortgage helper or for multi-gen families. Close to: transit, shopping, indoor/outdoor rec. & a host of UniverCity resident only perks. Act Now! Call for showing details.

Read

Just Sold: 003 9060 University Cr., Burnaby, Burnaby North, SFU

Gorgeous Forest Views

Spacious Layout

Priced at $424,800


Click here for more...


Investor, student and first-time buyer alert! This 1bed/1bath/545sqft above-ground home offers floor to ceiling windows and is nestled in lush forest and green space views. Features: brand new flooring throughout, freshly painted, an efficient floor plan, GE Cafe appliances, quartz counters, a spacious kitchen w/breakfast bar & covered balcony. Spacious master has large closet space & views. Altitude is Vancouver’s highest rising tower allowing rentals & pets. Bonus: locker & parking. Walk to: transit, campus, childcare, shopping, indoor/outdoor rec. & a host of resident-only perks. Do not miss your chance to enjoy living in this great lifestyle neighborhood! Act Now!

Read

Just Sold: 705 9009 Cornerstone Mews, Burnaby, Burnaby North, SFU

Stunning Views

Desirable Location

Price at $474,800


Click here for more...


Gorgeous endless South facing views. Huge partially covered roof-top deck. Top floor penthouse home! Your search ends here! Located in the "The Heart" of SFU, UniverCity, in The Hub, a concrete building. This 1 bed + large den with a window, 1 bath, 621sqft home is perfect for investors, first time buyers, students & everyone else in between. Features: a spacious plan, an open North/South exposure with no shared hallways, plenty of natural light, wood floors, a kitchen with SS apps, quartz counters & plenty of cupboards. The well sized master offers excellent closet space & large windows looking out to the covered balcony. Close to: transit, shopping, indoor/outdoor rec & a host of perks available only to UniverCity residents. Bonus: 1 parking, locker & rental & pet friendly. Act Now.

Read

 Provincial Housing Market Activity Normalizing into 2022

BCREA 2021 Third Quarter Housing Forecast Update

Third Quarter – August 2021


The pace of home sales in the province has slowed in recent months but an unprecedented start to the year still has BC on track for a record-breaking year.


An expected second-half slowdown has arrived, prompted by eroding affordability and a tightening of mortgage qualification rules. However, with the BC economy on track for very strong growth this year and next, along with the eventual return of normal migration flows, home sales are anticipated to remain well above long-run average levels into 2022.


Canadian mortgage rates have remained stable after rising from all-time lows earlier this year. At an average of just 2.14 per cent for a 5-year fixed rate and under 1.5 per cent for a variable rate, borrowing costs continue to be highly supportive of housing market activity. That said, the implementation of a new stress test rate, which is now the higher of a borrower’s contract rate plus 200 basis points and 5.25 per cent for both insured and uninsured mortgages, has likely taken some demand out of the market. Even with sales moderating slightly in the second half of this year, we are forecasting that home sales in 2021 will set a new record of 118,350 units before slowing to 100,150 units in 2022.


With strong demand being supported by low mortgage rates and a rapidly rebounding post-COVID economy, the more significant concern is whether there will be an adequate supply of listings in the market. The supply situation is especially severe in markets outside the Lower Mainland, where new listings activity has been lacklustre. Even if sales come back down to long-run average levels, total listings would need to nearly double to bring markets back into balance. Prices are under significant upward pressure due to extremely tight market conditions, while buyer preferences are still tilted toward extra space and larger homes. As a result, the average price in 2021 is on track to post a second consecutive year of double digit gains. We are forecasting the provincial average price to rise 16.6 per cent to $911,300 this year, followed by a 2.9 per cent gain next year to $937,300.


Click here for more...


Provided by: BCREA

“Copyright British Columbia Real Estate Association. Reprinted with permission.”

Read

Canadian home sales continue to normalize in July


Statistics released today by the Canadian Real Estate Association (CREA) show national home sales were down between June and July 2021.


Summary:

  • National home sales declined by 3.5% on a month-over-month basis in July.
  • Actual (not seasonally adjusted) activity declined by 15.2% year-over-year.
  • The number of newly listed properties dropped by 8.8% from June to July.
  • The MLS® Home Price Index (MLS® HPI) rose 0.6% month-over-month and was up 22.2% year-over-year.
  • The actual (not seasonally adjusted) national average sale price posted a 15.6% year-over-year gain in July.

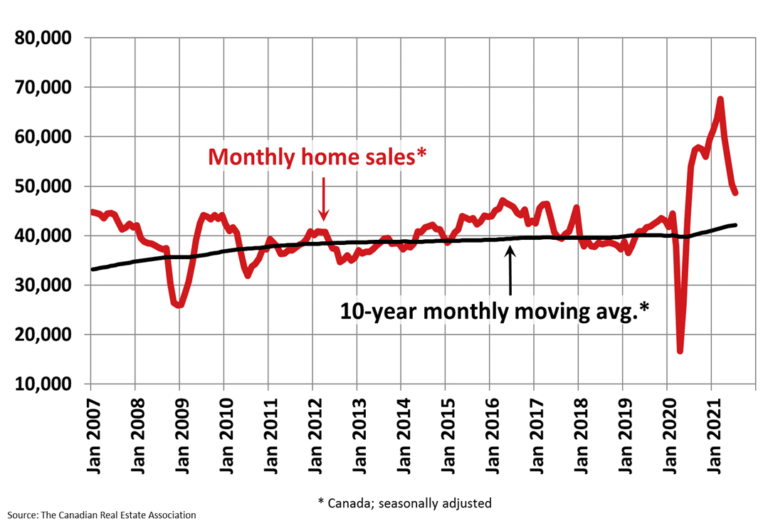
Home sales recorded over Canadian MLS® Systems edged back a further 3.5% on a month-over month basis in July 2021, marking the smallest of four consecutive declines since March. While sales are now down a cumulative 28% from that March peak, Canadian housing markets are still historically quite active.


Month-over-month declines in sales activity were less broad-based than seen in the past few months, although sales were still down in about two-thirds of all local markets. Declines were led by Edmonton and Calgary, although that may be because the current trend of softening sales is a little more recent in these markets. In a market like Montreal, where sales began to moderate way back at the start of the year, activity edged up month-over-month in July.


The actual (not seasonally adjusted) number of transactions in July 2021 was down 15.2% on a year-over-year basis from the record for that month set last July. July 2021 sales nonetheless still marked the second-best month of July on record.


“While the moderation of sales activity continues to capture most of the headlines these days, it’s record-low inventories that should be our focus,” said Cliff Stevenson, Chair of CREA. “We still have extremely unbalanced housing markets all over the country, so your best bet is to consult with your local REALTOR® for information and guidance about buying or selling a home in these still unprecedented and challenging times,” continued Stevenson.


“The slowdown we’ve seen in home sales over the last few months has not been surprising, given that the level of activity we were seeing back in March was unsustainable,” said Shaun Cathcart, CREA’s Senior Economist. “But we are not returning to normal, we are only returning to where we were before COVID, which was a far cry from normal. The problem of high housing demand amid low supply has not gone anywhere – it’s arguably worse. And after years of everyone agreeing that medium-density housing was the future, we are still referring to it as the ‘missing’ middle.”


The number of newly listed homes dropped by 8.8% in July compared to June, with declines led by a who’s who of big Canadian markets – the GTA, Montreal, Vancouver and Calgary. Across the country, new supply was down in about three-quarters of all markets in July.


This was enough to noticeably tighten the sales-to-new listings ratio despite sales activity also slowing on the month. The national sales-to-new listings ratio was 74% in July 2021, up from 69.9% in June. The long-term average for the national sales-to-new listings ratio is 54.7%.


Based on a comparison of sales-to-new listings ratio with long-term averages, the tightening of market conditions in July tipped a small majority of local markets back into seller’s market territory, reversing the trend of more balanced markets seen in June.


Another piece of evidence that conditions may be starting to stabilize was the number of months of inventory.  There were 2.3 months of inventory on a national basis at the end of July 2021, unchanged from June. This is extremely low – still indicative of a strong seller’s market at the national level and in most local markets. The long-term average for this measure is twice where it stands today.


The Aggregate Composite MLS® Home Price Index (MLS® HPI) rose 0.6% month-over-month in July 2021, continuing the trend of decelerating month-over-month growth that began in March. That deceleration has yet to show up in any noticeable way on the East Coast where property is relatively more affordable.


Additionally, a more recent point worth noting (and watching) just in the last month or so has seen prices for certain property types in certain Ontario markets look like they might be re-accelerating. This could be in line with a re-tightening of market conditions in some areas.


The non-seasonally adjusted Aggregate Composite MLS® HPI was up 22.2% on a year-over-year basis in July. While still a very large gain, it was, as expected, down from the record 24.4% year-over-year increase in June. The reason the year-over-year comparison has started to fall is that we are now more than a year removed from when prices really took off last year, so last year’s price levels are now catching up with this year’s, even though prices are currently still rising from month to month.


Looking across the country, year-over-year price growth is averaging around 20% in B.C., though it is lower in Vancouver, a bit lower in Victoria, and higher in other parts of the province. Year-over-year price gains a little under 10% were recorded in Alberta and Saskatchewan, while gains were a little over 10% in Manitoba.


Ontario saw year-over-year price growth slow to a still very high 25% in July. Trends observed in big, medium and smaller cities were similar to those in B.C., with gains notably lower in the GTA, around the provincial average in Oakville-Milton, Hamilton-Burlington and Ottawa, and considerably higher in most smaller markets in the province.


The opposite is true in Quebec, where Greater Montreal’s year-over-year price growth, at close to 24%, is double that of Quebec City at about 12%. Price growth is running a little above 30% in New Brunswick (higher in Greater Moncton, a little lower in Fredericton and Saint John), while Newfoundland and Labrador is in the 10% range on a year-over-year basis (a bit lower in St. John’s).


The MLS® HPI provides the best way to gauge price trends because averages are strongly distorted by changes in the mix of sales activity from one month to the next.


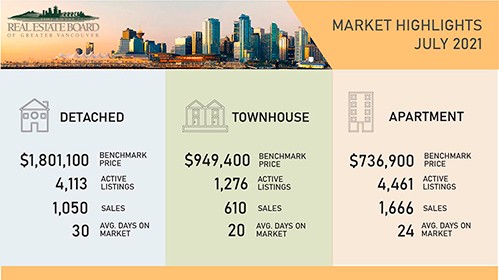
The actual (not seasonally adjusted) national average home price was a little under $662,000 in July 2021, up 15.6% from the same month last year. The national average price is heavily influenced by sales in Greater Vancouver and the GTA, two of Canada’s most active and expensive housing markets. Excluding these two markets from the calculation in July 2021 cuts around $132,000 from the national average price.


Provided by: CREA

Read

Just Listed: 003 9060 University Cr., Burnaby, Burnaby North, SFU

Gorgeous Forest Views

Spacious Layout

Priced at $424,800


Click here for more...


Investor, student and first-time buyer alert! This 1bed/1bath/545sqft above-ground home offers floor to ceiling windows and is nestled in lush forest and green space views. Features: brand new flooring throughout, freshly painted, an efficient floor plan, GE Cafe appliances, quartz counters, a spacious kitchen w/breakfast bar & covered balcony. Spacious master has large closet space & views. Altitude is Vancouver’s highest rising tower allowing rentals & pets. Bonus: locker & parking. Walk to: transit, campus, childcare, shopping, indoor/outdoor rec. & a host of resident-only perks. Do not miss your chance to enjoy living in this great lifestyle neighborhood! Act Now!

Read

Just Listed: 705 9009 Cornerstone Mews, Burnaby, SFU

Rental and Pet Friendly

1 Bed + Den, 1 Bath, 621sqft

$474,800


Gorgeous endless South facing views. Huge partially covered roof-top deck. Top floor penthouse home! Your search ends here! Located in the "The Heart" of SFU, UniverCity, in The Hub, a concrete building. This 1 bed + large den with a window, 1 bath, 608sqft home is perfect for investors, first time buyers, students & everyone else in between. Features: a spacious plan, an open North/South exposure with no shared hallways, plenty of natural light, wood floors, a kitchen with SS apps, quartz counters & plenty of cupboards. The well sized master offers excellent closet space & large windows looking out to the covered balcony. Close to: transit, shopping, indoor/outdoor rec & a host of perks available only to UniverCity residents. Bonus: 1 parking, locker & rental & pet friendly. Act Now.


Click here for more details...

Read

Steady sales, reduced listings and virtually unchanged home prices in July

VANCOUVER, BC – August 4, 2021 – Metro Vancouver’s* housing market saw more moderate sales, listings and pricing trends in July compared to the heightened activity experienced throughout much of the pandemic. 


The Real Estate Board of Greater Vancouver (REBGV) reports that residential home sales in the region totalled 3,326 in July 2021, a 6.3 per cent increase from the 3,128 sales recorded in July 2020, and an 11.6 per cent  decrease from the 3,762 homes sold in June 2021.


Last month’s sales were 13.3 per cent above the 10-year July sales average. “Moderation was the name of the game in July,” said REBGV’s economist Keith Stewart. “Home sales and listings fell in line with typical seasonal patterns as summer got going in earnest in July. On top of moderating market activity, price growth has leveled off in most areas
and home types.” 


There were 4,377 detached, attached and apartment homes newly listed for sale on the Multiple Listing Service® (MLS®) in Metro Vancouver in July 2021. This represents a 26.4 per cent decrease compared to the 5,948 homes listed in July 2020 and a 25.2 per cent decrease compared to June 2021 when 5,849 homes were listed.

July’s new listings were 12.3 per cent below the 10-year average for the month. The total number of homes currently listed for sale on the MLS® system in Metro Vancouver is 9,850, an 18.5 per cent decrease compared to July 2020 (12,083) and a 9.1 per cent decrease compared to June 2021 (10,839).


“Low housing supply remains a fundamental factor in Metro Vancouver’s housing market,” Stewart said. "Home sales remain above average and we’re starting to see price increases relent as well. Going forward, the supply of homes for sale will be among the most critical factors to watch. This will determine the next direction for house price trends."


For all property types, the sales-to-active listings ratio for July 2021 is 33.8 per cent. By property type, the ratio is 25.5 per cent for detached homes, 47.8 per cent for townhomes, and 37.3 per cent for apartments. Generally, analysts say downward pressure on home prices occurs when the ratio dips below 12 per cent for a sustained period, while home prices often experience upward pressure when it surpasses 20 per cent over several months.


The MLS® Home Price Index composite benchmark price for all residential properties in Metro Vancouver is currently $1,175,500. This represents a 13.8 per cent increase over July 2020 and is unchanged from June 2021.


Sales of detached homes in July 2021 reached 1,050, a 6.3 per cent decrease from the 1,121 detached sales recorded in July 2020. The benchmark price for a detached home is $1,801,100. This represents a 21 per cent increase from July 2020 and is unchanged from June 2021.


Sales of apartment homes reached 1,666 in July 2021, a 19 per cent increase compared to the 1,400 sales in July 2020. The benchmark price of an apartment property is $736,900. This represents an 8.4 per cent increase from July 2020 and a 0.1 per cent decrease compared to June 2021. 


Attached home sales in July 2021 totalled 610, a 0.5 per cent increase compared to the 607 sales in July 2020. The benchmark price of an attached home is $949,400. This represents a 16.7 per cent increase from July 2020 and a 0.3 per cent increase compared to June 2021. 


*Editor’s Note: Areas covered by the Real Estate Board of Greater Vancouver include: Burnaby, Coquitlam, Maple Ridge, New Westminster, North Vancouver, Pitt Meadows, Port Coquitlam, Port Moody, Richmond, South Delta, Squamish, Sunshine Coast, Vancouver, West Vancouver, and Whistler. 


The real estate industry is a key economic driver in British Columbia. In 2020, 30,944 homes changed ownership in the Board’s area, generating $2.1 billion in economic spin-off activity and an estimated 14,728 jobs. The total  dollar value of residential sales transacted through the MLS® system in Greater Vancouver totalled $33.7 billion in 2020. The Real Estate Board of Greater Vancouver is an association representing more than 14,000 REALTORS® and their companies. The Board provides a variety of member services, including the Multiple Listing Service®. For
more information on real estate, statistics, and buying or selling a home, contact a local REALTOR® or visit www.rebgv.org.

Read
Reciprocity Logo The data relating to real estate on this website comes in part from the MLS® Reciprocity program of either the Greater Vancouver REALTORS® (GVR), the Fraser Valley Real Estate Board (FVREB) or the Chilliwack and District Real Estate Board (CADREB). Real estate listings held by participating real estate firms are marked with the MLS® logo and detailed information about the listing includes the name of the listing agent. This representation is based in whole or part on data generated by either the GVR, the FVREB or the CADREB which assumes no responsibility for its accuracy. The materials contained on this page may not be reproduced without the express written consent of either the GVR, the FVREB or the CADREB.