The British Columbia Real Estate Association (BCREA) reports that a total of 8,203 residential unit sales were recorded by the Multiple Listing Service® (MLS®) across the province in April, a 16.8 per cent decrease from the same month last year. The average MLS® residential price in BC was $730,507, up 0.2 per cent from the previous year. Total sales dollar volume was $5.99 billion, a 16.7 per cent decline from April 2017.
“BC home sales were essentially unchanged in April compared to March, albeit up nearly 1 per cent on a seasonally adjusted basis,” said Cameron Muir, BCREA’s Chief Economist. “The impact of more burdensome mortgage qualifications for conventional borrowers is expected to soften over the next several months as potential buyers adjust both their finances and expectations.”
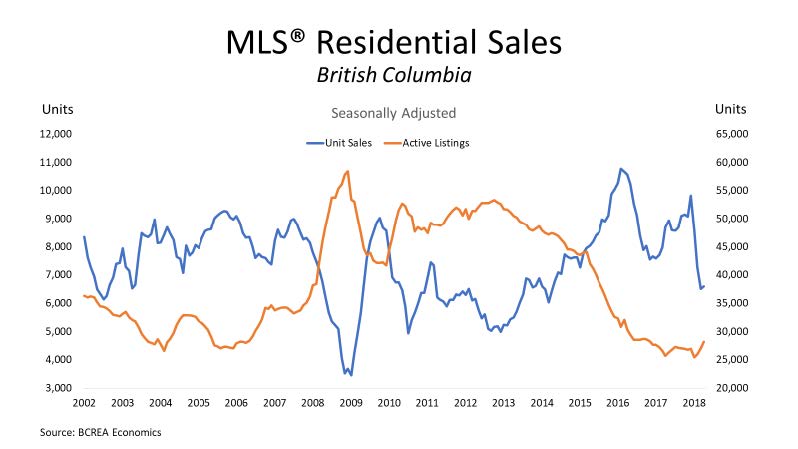
The supply of homes for sale in April increased 4 per cent from the previous month. However, total active listings on the market continue to remain low from a historical perspective. Most regions of the province have begun trending toward more balance between supply and demand, causing less upward pressure on home prices.
Year-to-date, BC residential sales dollar volume was down 6.7 per cent to $19.9 billion, compared with the same period in 2017. Residential unit sales decreased 11.8 per cent to 27,135 units, while the average MLS® residential price was up 5.7 per cent to $731,661.
April 2018 Residential Average Price, Active Listings and Sales-to-Active-Listings Data by Board
|
Board |
Average Price |
Active Listings |
Sales-to-Active-Listings |
|||||
|
April 2018 Residential Average Price ($) |
April 2017 Residential Average Price ($) |
% change |
April 2018 Residential Active Listings (Units) |
April 2017 Residential Active Listings (Units) |
% change |
April 2018 Residential Sales to Active Listings (%) |
April 2017 Residential Sales to Active Listings (%) |
|
|
BC Northern |
291,106 |
284,184 |
2.4 |
1,906 |
2,348 |
-18.8 |
20.6 |
14.8 |
|
Chilliwack |
533,020 |
460,388 |
15.8 |
989 |
909 |
8.8 |
36.5 |
40.9 |
|
Fraser Valley |
780,736 |
708,633 |
10.2 |
4,526 |
3,709 |
22 |
35.6 |
57.6 |
|
Greater Vancouver |
1,067,266 |
1,056,136 |
1.1 |
10,474 |
8,436 |
24.2 |
25.1 |
42.9 |
|
Kamloops |
371,459 |
360,723 |
3 |
1,044 |
1,198 |
-12.9 |
29.8 |
27.1 |
|
Kootenay |
297,070 |
311,753 |
-4.7 |
1,699 |
2,098 |
-19 |
17.1 |
13.5 |
|
Okanagan Mainline |
517,149 |
478,715 |
8 |
3,223 |
2,959 |
8.9 |
23.1 |
27.7 |
|
Powell River |
352,724 |
304,211 |
15.9 |
70 |
107 |
-34.6 |
47.1 |
33.6 |
|
South Okanagan |
440,828 |
384,804 |
14.6 |
964 |
966 |
-0.2 |
22.8 |
20 |
|
Northern Lights |
280,166 |
244,811 |
14.4 |
383 |
382 |
0.3 |
7.3 |
6 |
|
Vancouver Island |
470,435 |
422,719 |
11.3 |
2,182 |
2,264 |
-3.6 |
38.5 |
38 |
|
Victoria |
703,592 |
629,040 |
11.9 |
1,480 |
1,194 |
24 |
50 |
70.9 |
|
Provincial Totals* |
730,507 |
729,084 |
0.2 |
28,940 |
26,570 |
8.9 |
28.3 |
37.1 |
*Numbers may not add due to rounding
BCREA is the professional association for about 23,000 REALTORS® in BC, focusing on provincial issues that impact real estate. Working with the province’s 11 real estate boards, BCREA provides continuing professional education, advocacy, economic research and standard forms to help REALTORS® provide value for their clients.
To demonstrate the profession’s commitment to improving Quality of Life in BC communities, BCREA supports policies that help ensure economic vitality, provide housing opportunities, preserve the environment, protect property owners and build better communities with good schools and safe neighbourhoods.
For detailed statistical information, contact your local real estate board. MLS® is a cooperative marketing system used only by Canada’s real estate boards to ensure maximum exposure of properties listed for sale.
Comments:
Post Your Comment: