RSS

Strong Demand, Dwindling Supply for BC Housing Markets

The British Columbia Real Estate Association (BCREA) reports that a total of 12,638 residential unit sales were recorded by the Multiple Listing Service® (MLS®) in May 2021, an increase of 178.2 per cent over May 2020 when the onset of the COVID-19 pandemic prompted a lockdown of the provincial economy. The average MLS® residential price in BC was $916,340, a 26.2 per cent increase from $726,335 recorded in May 2020. Total sales dollar volume was $11.6 billion, a 251 per cent increase from last year.


“Provincial housing markets continue to calm after peaking in March,” said BCREA Chief Economist Brendon Ogmundson. “The implementation of a stricter mortgage stress test in June may have a minor impact on home sales but we expect strong market activity over the second half of the year.”


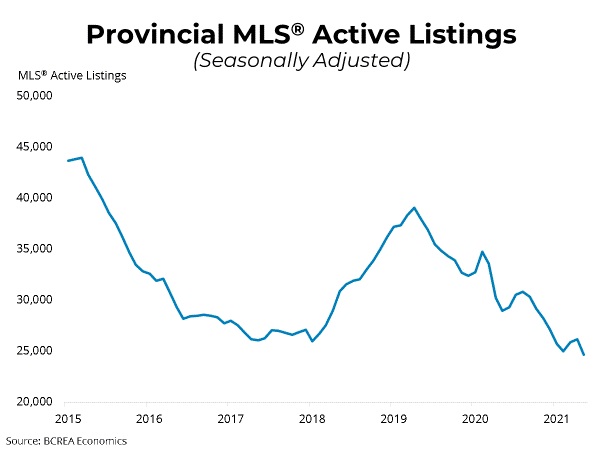
Total active residential listings were down 17 per cent year-over-year in May and dipped lower on a seasonally adjusted basis following two prior months of rising active listings.


“On the supply side, markets in the Lower Mainland are seeing a strong supply response, with new listings rising,” said Ogmundson, “however, new listings in markets outside of Metro Vancouver have started to flatten out.”


Click here for more...


Provided by: BCREA

Read

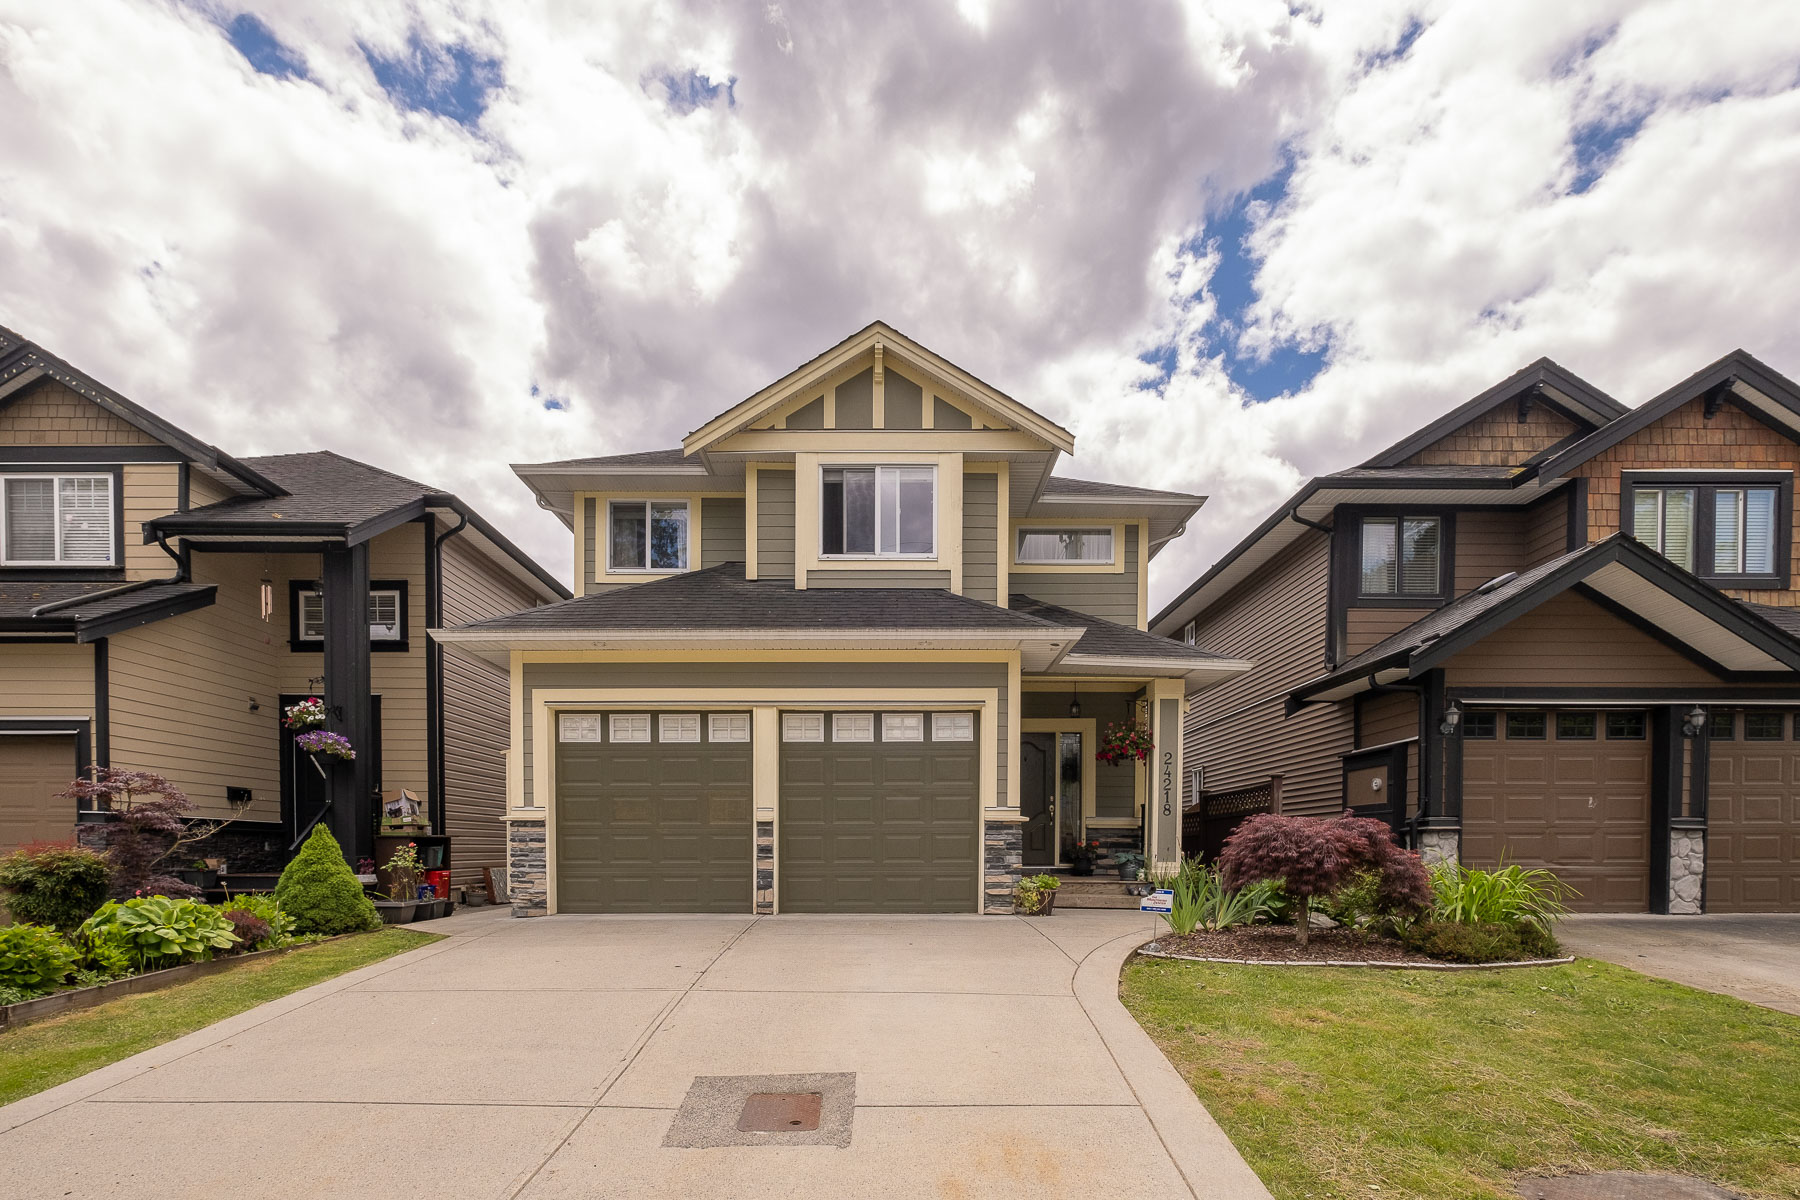
Just Listed: 24218 104 Avenue, Maple Ridge, Albion

Perfect Family Home

4 Bed & Den, 4 Bath, 2706sqft

Priced at $948,800


Click here for more...


Immaculate home in desirable family-oriented neighborhood. Functional layout shows well AND located in popular c̓əsqənelə catchment. Search no further! This 4 bed+den/4bath/3lvl/ 2706sqft home sits on a 3068sqft South facing lot. Features: plenty of natural light, fresh paint, welcoming entrance, great room style main floor, gourmet kitchen w/plenty of cupboard & counter space, SS appls, den & access to covered porch; perfect for year-round entertaining. Up: huge master w/ensuite & oversized soaker & walk-in closet, 2 well-sized rooms, laundry & nook space. Benefit from the bright, partially above ground 1 bed in-law suite w/laundry & extra space for up-stairs living. Bonus: large dble car garage w/tons storage & A/C! Fantastic location close to all amenities. Call for showing details.

Read

Just Sold: 302 9298 University Cr., Burnaby, Burnaby North, SFU


Bright, open and clean studio condo in convenient location atop Burnaby Mountain by Simon Fraser University. Solid concrete, quiet building (Novo I) 9' x 5' covered balcony. Well equipped fitness room in building. 1 parking, granite counters. Very functional floor plan. Rentals allowed and great investment.


Listing offered by: Sutton Group-West Coast Realty

Read

May 2021 Top 10
Congrats to all my fellow realtors and a big "Thank You" to all my clients for Trusting The Value in my services for their real estate Needs!
Read

Just Listed: 28 9229 University Cr., Burnaby, Burnaby North, SFU

Serenity Garage Home

3 bed, 3 bath, 1403sqft

Updated Throughout

Priced at $824,800


Click here for more...


Rarely available and highly sought after. Looking for more space? Always wanted a garage? Your search ends here. This 3bed/3bath/3lvl/1403sqft home w/tandem garage is located in Serenity of UniverCity, Vancouver's premier lifestyle neighborhood. Main: open layout w/tons of light, separate living & dining rms, laminate floors, updated kitchen w/SS appls, quartz counters, breakfast bar, eating area, & 2pc bath. Enjoy the private, covered green space facing balcony. Up: master w/5pc ensuite, updated counters & loads of closet space. 2nd & 3rd rms, all new flooring & 4pc bath w/updated counters complete this lvl. Lower: welcoming entrance w/heated floors & tons of storage. Close to: transit, shopping, indoor/outdoor rec. & a host of UniverCity resident only perks. Call now for showing details.

Read

Home sale and listing activity in Metro Vancouver moves off of its  record-breaking pace

The Metro Vancouver* housing market saw steady home sale and listing activity in May, a shift back from the record-breaking activity seen in the earlier spring months.


The Real Estate Board of Greater Vancouver (REBGV) reports that residential home sales in the region totalled 4,268 in May 2021, a 187.4 per cent increase from the 1,485 sales recorded in May 2020, and a 13 per cent decrease from the 4,908 homes sold in April 2021.


Last month’s sales were 27.7 per cent above the 10-year May sales average.


“While home sale and listing activity remained above our long-term averages in May, conditions moved back from the record-setting pace experienced throughout Metro Vancouver in March and April of this year,” Keith Stewart, REBGV economist said. “With a little less intensity in the market today than we saw earlier in the spring, home sellers need to ensure they’re working with their REALTOR® to price their homes based on current market conditions.”


There were 7,125 detached, attached and apartment properties newly listed for sale on the Multiple Listing Service® (MLS®) in Metro Vancouver in May 2021. This represents a 93.4 per cent increase compared to the 3,684 homes listed in May 2020 and a 10.2 per cent decrease compared to April 2021 when 7,938 homes were listed.


The total number of homes currently listed for sale on the MLS® system in Metro Vancouver is 10,970, a 10.5 per cent increase compared to May 2020 (9,927) and a 7.1 per cent increase compared to April 2021 (10,245).


"With sales easing down from record peaks, a revised mortgage stress test that reduces the maximum borrowing amounts by approximately 4.5 per cent, and the average five-year fixed mortgage rate climbing back over two per cent since the beginning of 2021, we’ll pay close attention to these factors leading into the summer to understand what affect they’ll have on the current market cycle,” Stewart said.


For all property types, the sales-to-active listings ratio for May 2021 is 38.9 per cent. By property type, the ratio is 29.8 per cent for detached homes, 53.8 per cent for townhomes, and 43.5 per cent for apartments.


Generally, analysts say downward pressure on home prices occurs when the ratio dips below 12 per cent for a sustained period, while home prices often experience upward pressure when it surpasses 20 per cent over several months.


“The seller’s market conditions experienced throughout much of the pandemic highlight the need for increasing the volume and variety of housing supply across our region,” Stewart said. “Doing this requires a more disciplined focus on planning, reducing building costs, understanding demographic changes, and expediting the building approval process.”


The MLS® Home Price Index1 composite benchmark price for all residential properties in Metro Vancouver is currently $1,172,800. This represents a 14 per cent increase over May 2020 and a 1.5 per cent increase compared to April 2021.


Sales of detached homes in May 2021 reached 1,430, a 166 per cent increase from the 537 detached sales recorded in May 2020. The benchmark price for a detached home is $1,800,600. This represents a 22.8 per cent increase from May 2020 and a 1.7 per cent increase compared to April 2021.

Sales of apartment homes reached 2,049 in May 2021, a 213 per cent increase compared to the 653 sales in May 2020. The benchmark price of an apartment home is $737,100. This represents a 7.9 per cent increase from May 2020 and a 1.2 per cent increase compared to April 2021.


Attached home sales in May 2021 totalled 800, a 168 per cent increase compared to the 298 sales in May 2020. The benchmark price of an attached home is $936,300. This represents a 16.3 per cent increase from May 2020 and a 1.8 per cent increase compared to April 2021.


Click here for more...


Provided by: REBGV

Read

Just Sold: 8 1251 Lasalle Pl., Coquitlam, Canyon Springs


Excellent Location in Chateau Lasalle, 4 Bed, 4 Bath, 2.310 Sqft. 2 stories with Walk out basement with 1Bed, Huge Rectration Room & Full Bath, south facing, Hardwood & Laminate flooring throughout the whole house, Gas fireplace, Master bedroom with walk-in closet. Private Fenced Patio, double garage, Walk to Walton Elementary, Scott Creek Middle School, Pinetree Secondary, Douglas College, Coquitlam Mall, Lafarge Lake, Evergreen Skytrain Station. 


Listing Offered by: Royal Pacific Tri-Cities Realty

Read

Just Sold: 413 9150 University High St., Burnaby, Burnaby North, SFU

Gorgeous Southern Views

3 bed, 3 bath, 1265sqft

Priced at $768,800


Click here for more...


Stunning South facing, top floor corner home with endless views from every room! Located in Origin, found at UniverCity; Vancouver's premier lifestyle neighborhood. This 3bed/3bath/1265sqft home with open, spacious plan and an abundance of light will not disappoint. Features: freshly painted, 9' ceilings, laminate floors w/radiant heat, functional kitchen & large island w/breakfast bar, gas stove, stone counters, plenty of cupboard & counter space, loads of in-suite storage, excellent sized balcony w/gas hookup & more. The large master offers pass-through closets & updated spa inspired 5pc ensuite w/soaker. 2nd bed has 3pc ensuite & balcony & the 3rd bed is well sized. Bonus; strata includes heat, gas & hot water. 2 side-by-side parking & storage & rental/pet friendly. Act Now! Call today.

Read

Housing market moderates in April compared to March

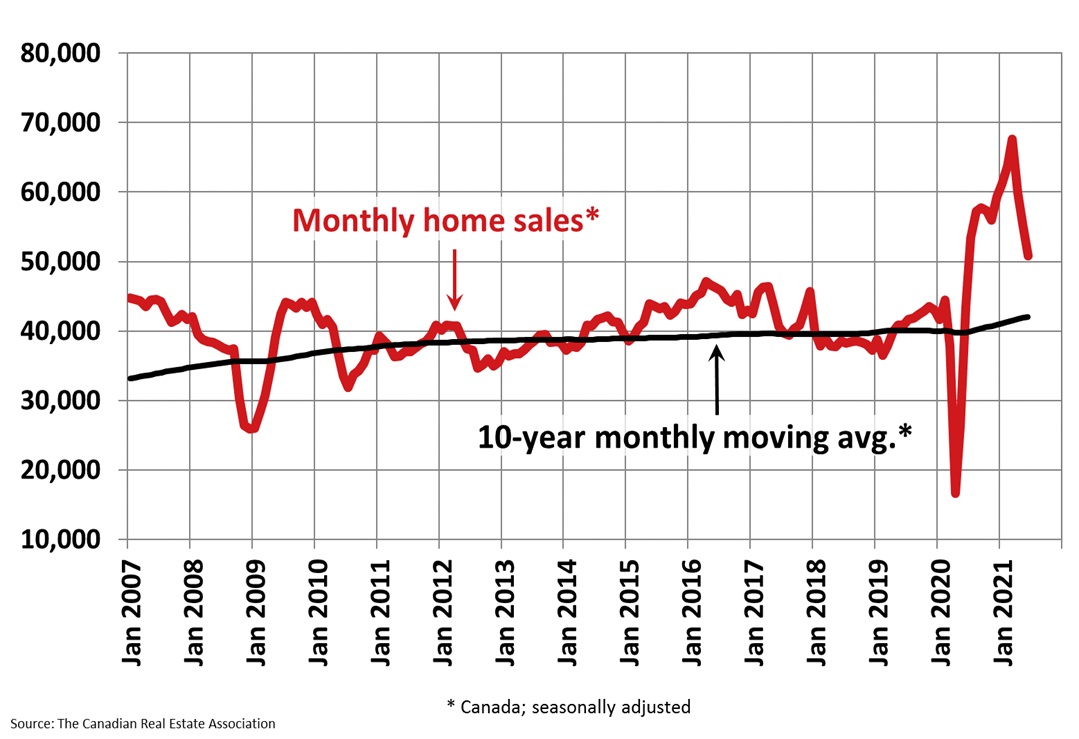
Statistics released today by the Canadian Real Estate Association (CREA) show national home sales were down from March to April 2021.


Summary:

  • National home sales declined by 12.5% on a month-over-month basis in April.
  • Actual (not seasonally adjusted) activity was up 256% year-over-year.
  • The number of newly listed properties fell back by 5.4% from March to April.
  • The MLS® Home Price Index (HPI) rose 2.4% month-over-month and was up 23.1% year-over-year.
  • The actual (not seasonally adjusted) national average sale price posted a 41.9% year-over-year gain in April.

Home sales recorded over Canadian MLS® Systems fell by 12.5% in April 2021 compared to the highest level ever recorded in March.


Month-over-month declines in sales activity were observed in close to 85% of all local markets, including virtually all of B.C. and Ontario.


In contrast, actual (not seasonally adjusted) sales activity posted a 256% year-over-year gain in April, reflecting the chasm between the best April ever in 2021 and the worst ever last year.


“While housing markets across Canada remain very active, there is growing evidence that some of the extreme imbalances of the last year are beginning to unwind, which is what everyone wants to see happen,” stated Cliff Stevenson, Chair of CREA. “That said, the slowdown in sales activity between March and April was at a time that COVID cases, including very concerning variants, hit their highest levels ever and many jurisdictions enacted fresh lockdowns, making it harder to get a clear read on the underlying levels of demand and supply. 2021 may be another year where some of the spring market gets pushed into the summer by COVID-19. As always, your best bet is to consult with your local REALTOR® for the best information and guidance about buying or selling a home this year,” continued Stevenson.


“Home sales were up by more than 250% on a year-over-year basis in April and the average price of those sales was up 42% – the biggest gains ever – which of course means that they were both down, from last month anyway,” said Shaun Cathcart, CREA’s Senior Economist. “Facetiousness aside, what we’re seeing is something known as the ‘base effect,’ which is the impact on statistics that results from the nature of the point of reference. In the case of the April 2021 housing numbers, the year-over-year is a comparison to the worst numbers ever published in April of last year, while the month-over-month relationship is to the strongest numbers ever published in March 2021. The result is that a relatively more ‘reasonable’ set of numbers in April 2021 looks both way up or way down depending on what crazy part of the last year you compare them to, but the correct interpretation of those big numbers is that the April housing numbers came in somewhere in between those extremes, which is a good thing. While we still have a ways to go, measures of market balance have finally turned a corner and monthly price growth has decelerated. I believe we’ve all wanted to see the temperature turned down on this market after the last year and it looks as though that is finally happening.”


The number of newly listed homes declined by 5.4% in April compared to March. In a market with historically low inventory, where sales activity depends on a steady supply of new listings each month, the synchronous gains in new supply and sales in March followed by synchronous declines in April suggest the slowdown in sales may be partially about availability of listings as opposed to only a demand story. New listings were down in 70% of all local markets in April.


The national sales-to-new listings ratio eased back to 75.2% in April compared to a peak level of 90.6% back in January. That said, the long-term average for the national sales-to-new listings ratio is 54.5%, so it is currently still high historically. The good news is that it is moving in the right direction.


Based on a comparison of sales-to-new listings ratio with long-term averages, only about a quarter of all local markets were in balanced market territory in April, measured as being within one standard deviation of their long-term average. The other three-quarters of markets were above long-term norms, in many cases well above.


The number of months of inventory is another important measure of the balance between sales and the supply of listings. It represents how long it would take to liquidate current inventories at the current rate of sales activity.


There were 2 months of inventory on a national basis at the end of April 2021, up from a record-low 1.7 months in March but still well below the long-term average for this measure of a little more than 5 months.

The Aggregate Composite MLS® Home Price Index (MLS® HPI) climbed by 2.4% month-over-month in April 2021 – a historically strong gain but less than in February and March. Most of the recent deceleration in month-over-month price growth has come from the single-family space compared to the more affordable townhome and apartment segments.

The non-seasonally adjusted Aggregate Composite MLS® HPI was up 23.1% on a year-over-year basis in April. Based on data back to 2005, this was a record year-overyear increase.


The largest year-over-year gains continue to be posted across Ontario (around 20-50%), followed by markets in B.C., Quebec and New Brunswick (around 10-30%), and lastly by gains in the Prairie provinces and Newfoundland and Labrador (around 5-15%).


The MLS® HPI provides the best way to gauge price trends because averages are strongly distorted by changes in the mix of sales activity from one month to the next.


The actual (not seasonally adjusted) national average home price was a little under $696,000 in April 2021, up 41.9% from the same month last year. That said, it is important to remember that the national average price dropped by 10% month-over-month last April as the higher-end of every market effectively shut down for a couple of months. That will serve to stretch these year-over-year comparisons over and above what is actually happening to prices until around June.


The national average price is also heavily influenced by sales in Greater Vancouver and the GTA, two of Canada’s most active and expensive housing markets. Excluding these two markets from calculations cuts more than $144,000 from the national average price.


Provided by: CREA

Read

Just Sold: 3380 Vincent St., Port Coquitlam, Glenwood PQ


Over $100,000 spent in renovating this home! The features are endless. The main floor has been redesigned to accommodate a high end luxurious kitchen finished with top of the line appliances: 2 Jenn-Air wall ovens, 2 cooktops (gas & electric!) beautiful cabinetry (tons of cupboard space) an extra large island for the busy multi-tasking family overlooking comfortable living room. 3 bright spacious bedrooms upstairs. Modern designer paint and flooring throughout. The added bonus is the easy front door access, with front yard garden space. Beautiful private back fenced patio with backdoor access to covered parking. Perfect location with just steps from the park, schools, recreation and shopping. This is an amazing design, truly, the ideal home.


Listing Provided by: Royal LePage Sterling Realty

Read

Thrilled To Be Ranked #1 in Social Media in Burnaby

#1: Hafez Panju

Royal LePage

When you hire someone to do something for you, you want the best of the best which is why you want Hafez from Burnaby. Tune into Hafez’s social media to stay on top of the Burnaby market!  


Instagram Highlights

 2,039 Followers
 27 Average Likes Per Post

 Quality Photos
 Great Graphic Design
 
Congrats, to all the other Realtors!
 
 
Provided By: Property Spark
 

Our researchers go through thousands of agents by searching hashtags, review sites, social media profiles and real estate portals. Then we rank agents based on our proprietary algorithm that takes into consideration multiple variables as seen below:

Instagram Followers

Instagram Average Likes Per Post

Facebook Likes/Friends

Facebook Average Likes Per Post

Quality Of Posts

and Other Social Channels


Read

Just Sold: 404 9339 University Cr., Burnaby, Burnaby North, SFU

Immaculate Condition

3 Bed, 2 bath 1239sqft

Priced at $598,800


Click here for more...


This bright, open 1239sqft/3bed/2bath corner home has large windows with plenty of natural light. Enjoy the treed lined views & sounds of nature from your covered balcony. Located in Harmony at the Highland, a pet & rental friendly building, in UniverCity, Vancouver's premier lifestyle neighborhood. Features: freshly painted, open living & dining rooms, excellent room separation, spacious kitchen w/eating area & newer stainless appliances & more. Enjoy cozy warmth from the gas F/P. The huge master fits kings size furniture, has ensuite w/soaker & walk-in closet. Both 2nd & 3rd bedrooms are well sized. Bonus: parking, locker & gym facilities. Close to: transit, shopping, indoor/outdoor recreation & a host of perks available only to UniverCity residences. Do not miss your chance! Act Now!

Read
Reciprocity Logo The data relating to real estate on this website comes in part from the MLS® Reciprocity program of either the Greater Vancouver REALTORS® (GVR), the Fraser Valley Real Estate Board (FVREB) or the Chilliwack and District Real Estate Board (CADREB). Real estate listings held by participating real estate firms are marked with the MLS® logo and detailed information about the listing includes the name of the listing agent. This representation is based in whole or part on data generated by either the GVR, the FVREB or the CADREB which assumes no responsibility for its accuracy. The materials contained on this page may not be reproduced without the express written consent of either the GVR, the FVREB or the CADREB.