RSS

Royal LePage: Canadian home prices forecast to rise 5.5% by the end of 2021 as low inventory and unmet demand set to fuel price increases
  • Aggregate price of a home in the Greater Toronto Area forecast to rise 5.75%
  • Tech and government sector expansion to drive Ottawa prices up 11.5%
  • Canada’s priciest city to experience 9.0% rise as housing demand in Vancouver surges
  • Halifax and Greater Montreal prices forecast to rise 7.5% and 6.0%, respectively
  • Calgary, Edmonton prices buck regional economic drag, to show modest price growth

 Housing demand exceeded expectations in the second half of 2020. The supply of homes available for sale failed to keep pace, driving home prices higher and pushing unmet buyer demand into the new year. According to the Royal LePage Market Survey Forecast, the aggregate [1] price of a home in Canada is set to rise 5.5 per cent year-over-year to $746,100 in 2021, with the median price of a two-storey detached house and condominium projected to increase 6.0 per cent and 2.25 per cent to $890,100 and $522,700, respectively. [2]


“The leading indicators we analyze are pointing to a market that favours property sellers in the all-important spring of 2021,” said Phil Soper, president and CEO, Royal LePage. “Across the country, a large number of hopeful buyers intent on improving their housing situation were not able to find the home they were looking for this year, as the inventory of properties for sale came nowhere near to meeting surging demand. With policy makers all but promising record low, industry supportive interest rates to continue, we do not see this imbalance improving in the new year. The upward pressure on home prices will continue.


“There was a clear shift towards larger properties and single-family dwellings in 2020, as families repurposed homes to become their office, school classroom, gymnasium and restaurant during the pandemic,” Soper continued. “We expect this trend to moderate as life returns to normal in the months ahead. It is also worth noting, that Canada welcomed a new generation of first-time homeowners this year, encouraged by lower financing costs and softer demand for city centre condominiums. Urban living remains attractive for many.”


The value of single-family houses and homes outside of major urban markets are forecast to continue to outpace city core condominiums in the year ahead, driven both by Canadians seeking larger homes in a time where remote work has become more commonplace, and broad-based demographic trends, including baby-boomer retirement.


“Mega-trends that predate the pandemic are pushing home prices higher in secondary markets outside of our largest cities. Corporate Canada’s pandemic-driven move to work-from-home operations has simply accelerated relocation patterns already underway,” said Soper. “The huge baby-boomer demographic began post-children migration to suburban and recreational-style communities in the middle of the last decade, and material numbers of the equally populous millennial generation have been exiting city centre condos in search of space as they began families.”


Soper added that the trend of high demand outside of urban centres will slowly ease as listings in city centres become more competitive against growing prices in suburban and exurban markets.


Immigration is critical to the housing market both indirectly, as it is supportive of economic growth, as well as directly through housing demand. In October, the federal government announced its plan to add more than 1.2 million immigrants over three years, a significant jump from previous years. Previously published Royal LePage research[3] into this demographic shows that newcomers to Canada typically rent for three years before purchasing, after which they have a material impact on new household formation and overall housing demand. An increase in immigration is supportive of both the resale market and investment demand for rental condominiums.


Nationally, the condominium segment is expected to see healthy demand in most of Canada’s largest cities. A notable exception is the Greater Toronto Area where a softer condominium market began emerging in the second half of 2020. Within the region, modest price gains for larger units outside of the city centre is expected to continue to offset softer demand in the downtown core. With the return of international university student rental demand and newly arrived immigrants in the second half of 2021, demand for centrally located units should increase.


The concern regarding the impact of potential mortgage defaults related to mortgage deferrals during the summer has eased significantly, as many Canadians who deferred payments have begun repayment. According to CMHC, as of September 30, 2020, the organization’s entire insured book of business has 5 per cent of loans with a payment deferral in place; a decline from approximately 8 per cent in August.[4]


“The first half of 2021 will be something of an economic and social tug-o-war between advancing medical science and surging housing demand,” concluded Soper. “The real estate brokerage industry has developed protocols that allow us to safely sell property during the pandemic, yet some would-be sellers will remain cautious and not list their properties while high levels of COVID-19 transmission remain the norm, restricting available housing supply.


For Complete Summary use this link...


Provided by: Royal LePage Canada

Read

Just Sold: 1563 Marine Cr., Coquitlam, Harbour Place

Fully Renovated

Harbour Place

Priced at $1,648,000


Click here for more...


Stunning! Fully renovated family home, in Harbour Place, one of Coquitlam's sought-after neighborhoods. Your search ends here! This 4bed/3bath/3158sqft home sits on a private, East facing 11,255sqft lot. The main level features a gorgeous open plan; perfect for entertaining. The kitchen has full size SS freezer & fridge, huge island w/breakfast bar & access to the massive re-surfaced deck. A spacious master w/updated ensuite, 2 good sized rms, updated 4 pc bath & hardwood floors & brand new carpets. Down has laundry area, home-office & is suite ready: entrance, kitchen & living areas, 1bed/bath & W/D hook-ups. Bonus: 20X14 workshop w/power & concrete floors & tons of parking. Upgrades: furnace, roof, HW tank, fence, electrical, plumbing, ext. rock & stucco & more. Act Now! Call today.

Read

BC Housing Market Posts Strongest November on Record

The British Columbia Real Estate Association (BCREA) reports that a total of 9,416 residential unit sales were recorded by the Multiple Listing Service® (MLS®) in November 2020, an increase of 42.1 per cent from November 2019. The average MLS® residential price in BC set a record of $816,074, a 9.3 per cent increase from $746,310 recorded the previous year. Total sales dollar volume in August was $7.68 billion, a 55.4 per cent increase over 2019.


“Home sales were once again unseasonably strong in November with several markets setting records for the month,” said BCREA Chief Economist Brendon Ogmundson. “While demand continues to be strong, the supply of listings has reached near-record lows in several parts of the province, with prices rising sharply as a result.”


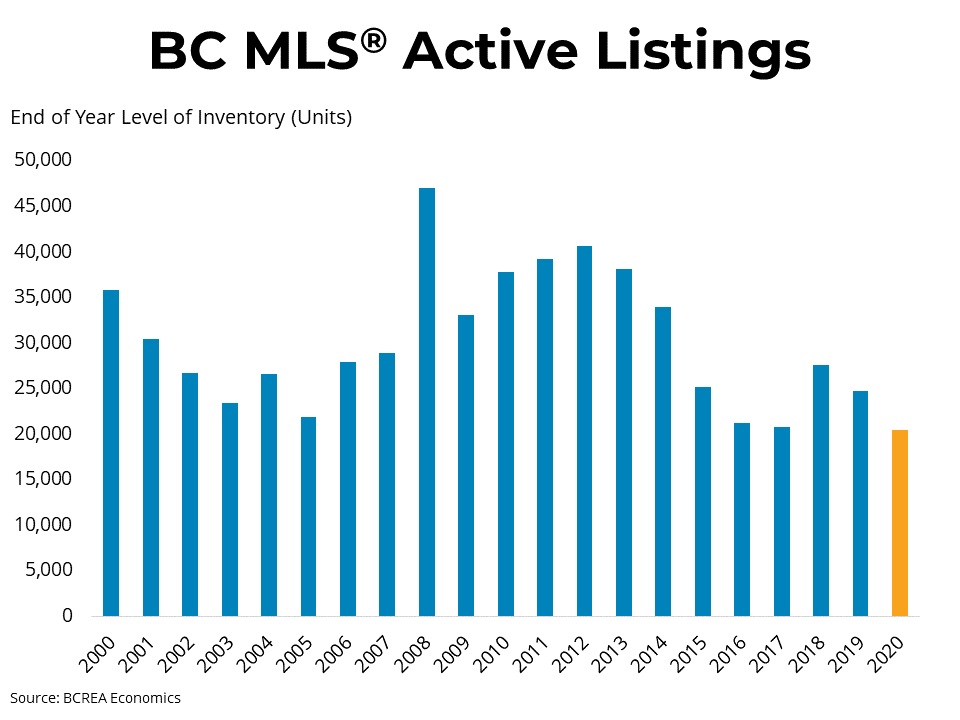
Active listings were down close to 14 per cent year-over-year in November, which contributed to a 34.8 per cent sales-to-active listings ratio. Consequently, the provincial average price rose 9.3 per compared to this time last year with many markets seeing even stronger price growth.


Year-to-date, BC residential sales dollar volume was up 32.3 per cent to $66.43 billion, compared with the same period in 2019. Residential unit sales were up 18.7 per cent to 85,625 units, while the average MLS® residential price was up 11.4 per cent to $775,845. 


Click here for more...


Provided by: BCREA

Read

Just Sold: 512 9009 Cornerstone Mews., Burnaby, Burnaby North, SFU


Spacious 1 Bed Condo

The Heart of SFU

Price at $388,000


Click here for more...


Looking for that perfect 1 bed condo & can't seem to find it? Well your search ends here! Located in the "The Heart" of SFU, UniverCity, in The Hub, a concrete, LEED building. This 1bed/1bath/587sqft home is perfect for investors, first time buyers, aspiring students & everyone else in between. Features: an open concept plan, plenty of natural light, wood floors, a kitchen with SS apps, quartz counters & plenty of cupboards. The well sized master offers excellent closet space & large windows looking out to the covered balcony. Close to: transit, shopping, indoor/outdoor rec & a host of perks available only to UniverCity residents. Do not miss your chance to enjoy living in this great lifestyle neighborhood! Bonus: 1 parking, locker & rental & pet friendly. Act Now.

Read

November home sales outpace seasonal norms and long-term averages

Housing demand in Metro Vancouver* continues to outpace historical averages with November sales eclipsing 3,000 for the first time since 2015.


The Real Estate Board of Greater Vancouver (REBGV) reports that residential home sales in the region totalled 3,064 in November 2020, a 22.7 per cent increase from the 2,498 sales recorded in November 2019, and a 16.9 per cent decrease from the 3,687 homes sold in October 2020.


Last month’s sales were 24.6 per cent above the 10-year November sales average and was the second highest total in this period.


“Home buyer demand has been at near record levels in our region since the summer,” Colette Gerber, REBGV Chair said. “This is putting upward pressure on home prices, particularly in our detached and townhome markets."

There were 4,068 detached, attached and apartment homes newly listed for sale on the Multiple Listing Service® (MLS®) in Metro Vancouver in November 2020. This represents a 36.2 per cent increase compared to the 2,987 homes listed in November 2019 and a 27 per cent decrease compared to October 2020 when 5,571 homes were listed.


The total number of homes currently listed for sale on the MLS® system in Metro Vancouver is 11,118, a 3.2 per cent increase compared to November 2019 (10,770) and a 10.5 per cent decrease compared to October 2020 (12,416).


"The supply of homes for sale are a critical factor in understanding home price trends," Gerber said. "The total number of homes for sale in Metro Vancouver is lagging behind the pace of demand right now. This trend favours home sellers in today's market."


For all property types, the sales-to-active listings ratio for November 2020 is 27.6 per cent. By property type, the ratio is 27.9 per cent for detached homes, 40.1 per cent for townhomes, and 23.9 per cent for apartments.


Generally, analysts say downward pressure on home prices occurs when the ratio dips below 12 per cent for a sustained period, while home prices often experience upward pressure when it surpasses 20 per cent over several months.


Within the region, the Sunshine Coast saw the largest increase in year-over-year demand with 106 home sales in November 2020, an 82.8 per cent increase over November 2019 (58).


“While demand remained elevated across the region, home buyer activity was particularly focused in more remote areas like the Sunshine Coast, Gulf Islands and Squamish,” Gerber said.


“The rise of work-from-home arrangements and physical distancing policies is causing some home buyers to opt for less densified areas.”


The MLS® Home Price Index composite benchmark price for all residential properties in Metro Vancouver is currently $1,044,000. This represents a 5.8 per cent increase over November 2019 and a 0.1 per cent decrease compared to October 2020.


Sales of detached homes in November 2020 reached 1,061, a 28.6 per cent increase from the 825 detached sales recorded in November 2019. The benchmark price for a detached home is $1,538,900. This represents a 9.4 per cent increase from November 2019 and a one per cent increase compared to October 2020.


Sales of apartment homes reached 1,371 in November 2020, a 12.2 per cent increase compared to the 1,222 sales in November 2019. The benchmark price of an apartment home is $676,500. This represents a 3.4 per cent increase from November 2019 and a one per cent decrease compared to October 2020.


Attached home sales in November 2020 totalled 632, a 40.1 per cent increase compared to the 451 sales in November 2019. The benchmark price of an attached home is $814,800. This represents a 5.6 per cent increase from November 2019 and a 0.2 per cent increase compared to October 2020. 


Click here for more...


Provided by: REBGV

Read

NEW PRICE: 409 9339 University Cr., Burnaby, Burnaby North, SFU

Endless Views

Excellent Layout

Priced at $568,800


 Click here for more...


Stunning top floor corner home located at the apex of the building. South East facing completely updated w/endless views. Your search ends here! This 2bed/2bath/1083sqft home features an abundance of light from 180 degrees of windows, a welcoming entrance & excellent room separation. Updates: quality flooring, resurfaced kitchen cabinets w/stone counters, updated apps, newer plumbing & light fixtures & more. The kitchen has eating area & access to covered balcony. Entertain in an open living & dining area w/cozy gas F/P. The spacious master has walk-in closet & ensuite. The 2nd bed is well sized w/large closet. Located in Harmony, this popular complex is rental & pet friendly. Close to: transit, shopping, nature, indoor/outdoor rec. & a host of UniverCity resident only perks. Act Now!

Read

Just Sold: C322 20211 66th Ave., Langley, Willoughby Heights

Excellent Central Location

Rental and Pet Friendly

Price at $468,800


Click here for more...


Bright, open and functional are just a few ways to describe this fantastic unit. Located in the popular Elements building in the desirable Willoughby Heights neighborhood of Langley, with a location that can't be beat. Welcome home! Features: modern finishing, over height ceilings, spacious layout, laminate floors through & newer carpets in the bedrooms, a spacious kitchen w/plenty cupboard & granite counters space & SS apps, laundry closet w/extra storage & an excellent sized balcony perfect for BBQs. The large master has passthrough closets & 3 pc spa inspired ensuite while the 2nd bed is well sized. Bonus: 1 parking, locker on your floor & rental and pet friendly. Located close to shopping, recreation, transit, schools, parks and more. Act Now!

Read

NEW PRICE: 20314 Wharf St., Maple Ridge, South West Maple Ridge

Beautiful waterfront property! Wake every morning and enjoy your first sip of Java looking out on a gorgeous, still sheet of water. Own your own private dock. Soak in the peace and quiet and serenity. Look no further. This 5850sqft level lot has been cleared, undergone both a geotechnical and erosion control plans and has passed Alternation Permit under the BC Archaeology Branch. Building plans available for a 5700sqft+ 3 level Home. Act Now!


Click here for more...

Read

Just Sold: 478 Mundy St., Coquitlam, Central Coquitlam

Luxury living at its finest. Top to bottom, in/out no expense spared. This 8bed/10bath/3-car garage/7136sqft home sits on a 9600sqft West facing level lot w/lane access in desirable Central Coquitlam. Features: over height ceilings on every floor, Control4 automation, 10 zone radiant heat, AC, LoE 366 windows, 8 camera sec, Miele appliance package, spice kitchen, guest bed on main floor, 1 bed legal suite, nanny quarters, media room, built-in speakers throughout & much more. The stunning great room has 20' ceilings, floor to ceiling tile wall, 60" F/P & direct yard access. Enjoy summer nights on the covered deck complete w/infra red heaters & speakers. Indulge in an 800sqft master suite w/spa inspired ensuite, soaker tub & oversized shower. All this and a location that can't be beat!


Click here for more...

Read

Canadian home sales remain historically strong in October


Statistics released today by the Canadian Real Estate Association (CREA) show national home sales continued running at historically strong levels in October 2020.


Summary:

  • National home sales edged back 0.7% on a month-over-month (m-o-m) basis in October.
  • Actual (not seasonally adjusted) activity was up 32.1% year-over-year (y-o-y).
  • The number of newly listed properties rose 2.9% from September to October.
  • The MLS® Home Price Index (HPI) rose 1% m-o-m and was up 10.9% y-o-y.
  • The actual (not seasonally adjusted) national average sale price posted a 15.2% y-o-y gain in October.

Home sales recorded over Canadian MLS® Systems in October 2020 edged back by 0.7% from September’s all-time record for monthly sales.


The small change from September to October reflected gains in about half of all local markets offset by declines in the other half. Among the larger markets, activity was up on the month in Montreal, the Fraser Valley, Calgary and Edmonton. By contrast, sales fell back in Greater Toronto Area (GTA), Hamilton-Burlington, Ottawa and Greater Vancouver.


Actual (not seasonally adjusted) sales activity posted a 32.1% y-o-y gain in October. It was a new record for that month by a margin of more than 14,000 transactions. For the fourth straight month, sales activity was up in almost all Canadian housing markets compared to the same month in 2019. Among the few markets that were down on a year-over-year basis, it is possible the handful that are in Ontario simply do not have the supply at the moment.


So far this year, some 461,818 homes have traded hands over Canadian MLS® Systems, up 8.6% from the first 10 months of 2019. In fact, it was the second-highest January-October sales figure on record, trailing only 2016.


“Many Canadian housing markets continue to see historically strong levels of activity, and at this point over and above what would have been required to make up for the very quiet spring market this year,” stated Costa Poulopoulos, Chair of CREA. “As you may have heard, as of October 19 CREA is once again recommending against in-person open houses. We’ll have to wait and see how a return to more restrictive safety measures impacts housing markets as we move towards the end of this strange year, particularly if it leads to fewer people putting their homes up for sale in regions that already have historic supply shortages. In the meantime, we will remain vigilant in adhering to government and health officials’ directives to keep our clients safe, including the use of all the virtual technology solutions that were so popular back in the spring. Now as always, REALTORS® remain the best source for information and guidance when negotiating the sale or purchase of a home,” continued Poulopoulos.


“For anyone waiting for the Canadian existing home market to begin to settle down following this summer’s surprisingly strong recovery, they’re going to have to wait a little longer. It was evident that the same trends we’ve been seeing since July – record sales and record prices amid tight overall supply – was once again the story in October,” said Shaun Cathcart, CREA’s Senior Economist. “As we’ve moved through the last few months of headline-grabbing data, we’ve seen sales activity for the year-to-date not just catch up with last year, which was surprising enough, but at this point activity in 2020 has a real shot at setting an annual record. Many reasons have been suggested for why this is when many traditional drivers of the market, economic growth, employment and confidence in particular, are currently so weak. Something worth considering is how many households are choosing to pull up stakes and move as a result of COVID-19 and all the associated changes to our lives. We could be seeing a lot of moves, or churn in the market, that would not have happened in a non-COVID world.”


The number of newly listed homes climbed 2.9% in October. The overall gain in new supply in October was driven by more new listings in the GTA, B.C.’s Lower Mainland and Ottawa. As with sales activity, actual (not seasonally adjusted) new listings set a new record for the month of October; however, it was by far less of a margin than sales, meaning market conditions are still very tight in many parts of the country.


With new supply up in October and sales relatively little changed, the national sales-to-new listings ratio eased to 74.3% — still among the highest levels on record for the measure. The long-term average for the national sales-to-new listings ratio is 54.1%.


Based on a comparison of sales-to-new listings ratio with long-term averages, about a third of all local markets were in balanced market territory in October, measured as being within one standard deviation of their long-term average. The other two-thirds of markets were above long-term norms, in many cases well above.


The number of months of inventory is another important measure of the balance between sales and the supply of listings. It represents how long it would take to liquidate current inventories at the current rate of sales activity.

There were just 2.5 months of inventory on a national basis at the end of October 2020 – the lowest reading on record for this measure. At the local market level, some 18 Ontario markets were under one month of inventory at the end of October.


The Aggregate Composite MLS® Home Price Index (MLS® HPI) rose by 1% m-o-m in October 2020. Of the 39 markets now tracked by the index, all but one were up between September and October.


The non-seasonally adjusted Aggregate Composite MLS® HPI was up 10.9% on a y-o-y basis in October – the biggest gain since July 2017.


The largest y-o-y gains – more than 25% – were recorded in Quinte & District and Woodstock-Ingersoll.

Y-o-y price increases in the 20-25% range were seen in Ottawa, London & St. Thomas, Tillsonburg District and a number of Ontario cottage country areas.


This was followed by y-o-y price gains in the range of 15-20% in Barrie, Hamilton, Niagara, Guelph, Bancroft and Area, Brantford, Cambridge, Huron Perth, Kitchener-Waterloo, North Bay, Peterborough and the Kawarthas, Simcoe & District, Montreal and Greater Moncton.


Prices were up in the 10-15% range compared to last October in the GTA, Oakville-Milton, Mississauga and Northumberland Hills.


Meanwhile, y-o-y price gains were in the 5-10% range in Greater Vancouver, the Fraser Valley, the Okanagan Valley, Regina, Saskatoon, Winnipeg and Quebec City. Gains were less than 4% in Victoria and elsewhere on Vancouver Island, as well as in St. John’s, and prices were just inside positive territory y-o-y in Calgary and Edmonton.


The MLS® HPI provides the best way to gauge price trends because averages are strongly distorted by changes in the mix of sales activity from one month to the next.


The actual (not seasonally adjusted) national average home price set another record in October 2020, coming in at $607,250. This was up 15.2% from the same month last year.


The national average price is heavily influenced by sales in Greater Vancouver and the GTA, two of Canada’s most active and expensive housing markets. Excluding these two markets from calculations cuts more than $127,000 from the national average price.


Provided by: CREA

Read

BC Housing Market Continues Record Pace in October


The British Columbia Real Estate Association (BCREA) reports that a total of 11,051 residential unit sales were recorded by the Multiple Listing Service® (MLS®) in October 2020, an increase of 43.8 per cent from October 2019.


The average MLS® residential price in BC set a record of $812,960, a 12.5 per cent increase from $722,333 recorded the previous year. Total sales dollar volume in August was $8.98 billion, a 61.8 per cent increase over 2019. “The provincial housing market sustained its blistering pace of activity in October,” said BCREA Chief Economist Brendon Ogmundson. “While pent-up demand may be starting to fade, record low interest rates and a recovering job market are supporting strong sales.”


“A pandemic-driven shift in buyers’ preference for extra space is pushing average prices to record highs as larger value transactions account for a higher share of sales,” added Ogmundson. Prices are also being pushed higher by a lack of inventory. Total provincial active listings continue to trend lower and were close to 14 per cent lower in October 2020 compared to 2019.


Year-to-date, BC residential sales dollar volume was up 29.7 per cent to $58.7 billion, compared with the same period in 2019. Residential unit sales were up 16.3 per cent to 76,140 units, while the average MLS® residential price was up 11.5 per cent to $771,085.


Click here for more....


Provided by: BCREA

Read

Just Sold: 1107 9060 University Cr., Burnaby, Burnaby North, SFU


View! View! View! Altitude built by Award-winning Hungerford. This 2 bedroom, 2 bathroom offers a spacious & open layout. High end finishes throughout; quartz countertops, GE Cafe Stainless appliances & front load washer/dryer. Just steps away from Simon Fraser University, groceries, restaurants and public transit. Amenities include a party room, gym & garden areas.


Listing Offered by: Sincere Real Estate Services

Read
Reciprocity Logo The data relating to real estate on this website comes in part from the MLS® Reciprocity program of either the Greater Vancouver REALTORS® (GVR), the Fraser Valley Real Estate Board (FVREB) or the Chilliwack and District Real Estate Board (CADREB). Real estate listings held by participating real estate firms are marked with the MLS® logo and detailed information about the listing includes the name of the listing agent. This representation is based in whole or part on data generated by either the GVR, the FVREB or the CADREB which assumes no responsibility for its accuracy. The materials contained on this page may not be reproduced without the express written consent of either the GVR, the FVREB or the CADREB.