RSS

For many Canadians, their home is the most important investment they will make in their lifetime. That is why the Government of Canada has introduced measures to help more Canadians achieve their housing needs while also taking measured actions to contain risks in the housing market. A stable and healthy housing market is part of a strong economy, which is vital to building and supporting a strong middle class.


Today, Minister of Finance, Bill Morneau, announced changes to the benchmark rate used to determine the minimum qualifying rate for insured mortgages, also known as the “stress test.” These changes will come into effect on April 6, 2020. The new benchmark rate will be the weekly median 5-year fixed insured mortgage rate from mortgage insurance applications, plus 2%.


This follows a recent review by federal financial agencies which concluded that the minimum qualifying rate should be more dynamic to better reflect the evolution of market conditions. Overall, the review concluded that mortgage standards are working to ensure that home buyers are able to afford their homes even if interest rates rise, incomes change, or families are faced with unforeseen expenses. This adjustment to the stress test will allow it to be more representative of the mortgage rates offered by lenders and more responsive to market conditions.


The Office of the Superintendent of Financial Institutions (OSFI) also announced today that it is considering the same new benchmark rate to determine the minimum qualifying rate for uninsured mortgages. OSFI is seeking input from interested stakeholders on this proposal before March 17, 2020.

Quotes

“For many middle class Canadians, their home is the most important investment they will make in their lifetime. Our government has a responsibility to ensure that investment is protected and to support a stable housing market. The government will continue to monitor the housing market and make changes as appropriate. Reviewing the stress test ensures it is responsive to market conditions.”

Bill Morneau, Minister of Finance

Quick facts

  • When a borrower has less than a 20% down payment, lenders are required to obtain government-backed mortgage insurance. The mortgages must comply with the insured mortgage rules set by the Minister of Finance, including the insured minimum qualifying rate.

  • When the borrower has a down payment of 20%, or more, of the sale price, insurance is not required. The minimum qualifying rate for uninsured mortgages is set by OSFI, the independent banking regulator.

  • To help more Canadians access affordable housing that meets their needs, the Government of Canada launched the National Housing Strategy—a 10-year, $55+ billion plan that will build 125,000 new affordable housing units, repair 300,000 others, and reduce chronic homelessness by 50%.

  • In Budget 2019, the federal government took concrete steps to make homeownership more affordable for first-time buyers by implementing a First-Time Home Buyer Incentive and increasing the Registered Retirement Savings Plan withdrawal limit to $35,000 to buy a home. 

Provided by: Government of Canada

Read

Canadian home sales down in January

Statistics released today by the Canadian Real Estate Association (CREA) show national home sales declined between December 2019 and January 2020.


Highlights:

  • National home sales fell by 2.9% on a month-over-month (m-o-m) basis in January.
  • Actual (not seasonally adjusted) activity was up 11.5% year-over-year (y-o-y).
  • The number of newly listed properties was little changed (+0.2%) m-o-m.
  • The MLS® Home Price Index (HPI) advanced by 0.8% m-o-m and 4.7% y-o-y.
  • The actual (not seasonally adjusted) national average sale price climbed 11.2% y-o-y.

Home sales recorded over Canadian MLS® Systems declined by 2.9% in January 2020, although they remain among the stronger monthly readings of the last few years. (Chart A)


Transactions were down in a little over half of all local markets in January, with the national result most impacted by a slowdown of more than 18% in the Lower Mainland of British Columbia. While there were few notable gains in January, it should be noted that many of the weaker results have come alongside a shortage of new supply in markets where inventories are already very tight.


Actual (not seasonally adjusted) sales activity was still up 11.5% compared to January 2019, marking the best sales figures for the month in 12 years. Transactions surpassed year-ago levels in about two-thirds of all local markets, including most of the largest urban markets. As mentioned, some of the larger markets where sales were down, such as Ottawa and Windsor-Essex, are currently among some of the tightest supplied markets in Canada.


“Home price growth continues to pick up in housing markets where listings are in short supply, particularly in Southern, Central and Eastern Ontario,” said Jason Stephen, president of CREA. “Meanwhile, ample supply across the Prairies and in Newfoundland and Labrador is resulting in ongoing competition among sellers. All real estate is local, and nobody knows that better than a professional REALTOR®, your best source for information and guidance when negotiating the sale or purchase of a home,” said Stephen.


“Looking at local market trends across the country, one thing that stands out in markets with historically tight supply is a larger than normal drop in new listings at this time of the year,” said Shaun Cathcart, CREA’s Senior Economist. “The logic being that if you are a seller, you’re not just choosing when to list but effectively when to sell, so why not hold off until the spring when the weather is better, and more buyers are looking? Deferred listings mean deferred sales, which could explain some of January’s decline in activity. The question going forward is how many sellers are out there waiting to list their property, how much demand will respond, and how that will impact prices later this year.”


The number of newly listed homes was little changed in January, edging up a slight 0.2% on the heels of a series of declines which have left new listings at a near decade low. January’s small m-o-m change came as the result of declines in a number of larger markets, including Calgary, Edmonton and Montreal, which were offset by gains in the York and Durham Regions of the Greater Toronto Area (GTA) where new supply bounced back at the start of 2020 following a sharp slowdown towards the end of last year.


With sales down and new listings up slightly in January, the national sales-to-new listings ratio fell back to 65.1% compared to 67.2% posted in December 2019. Even so, the long-term average for this measure of housing market balance is 53.8%. It has been significantly above that long-term average for the last four months. Barring an unforeseen change in recent trends between the balance of supply and demand for homes, price gains appear poised to accelerate in 2020.


Considering the degree and duration to which market balance readings are above or below their long-term averages is the best way of gauging whether local housing market conditions favour buyers or sellers. Market balance measures that are within one standard deviation of their long-term average are generally consistent with balanced market conditions.


Based on a comparison of the sales-to-new listings ratio with the long-term average, close to two-thirds of all local markets were in balanced market territory in January 2020. Apart from a few areas of Alberta and Saskatchewan, the remainder were all favouring sellers.


The number of months of inventory is another important measure of the balance between sales and the supply of listings. It represents how long it would take to liquidate current inventories at the current rate of sales activity.


There were 4.2 months of inventory on a national basis at the end of January 2020 – the same as in November and December and the lowest level since the summer of 2007. This measure of market balance is now a full month below its long-term average of 5.2 months. While still just within balanced market territory, its current reading suggests that sales negotiations are becoming increasingly tilted in favour of sellers.


National measures of market balance continue to mask significant and increasing regional variations. The number of months of inventory has swollen far beyond long-term averages in the Prairie provinces and Newfoundland & Labrador, giving homebuyers ample choice in these regions. By contrast, the measure is running well below long-term averages in Ontario, Quebec and the Maritime provinces, resulting in increased competition among buyers for listings and providing fertile ground for price gains. The measure is still in balanced market territory in British Columbia.


The Aggregate Composite MLS® Home Price Index (MLS® HPI) rose 0.8% in January 2020 compared to December, marking its eighth consecutive monthly gain. It is now up 5.5% from last year’s lowest point in May and has set new records in each of the past six months. (Chart B)


The MLS® HPI in January was up from the previous month in 14 of the 18 markets tracked by the index. (Table 1)


Home price trends have generally been stabilizing in most Prairie markets in recent months following lengthy declines. Meanwhile, prices are clearly on the rise again in British Columbia and in Ontario’s Greater Golden Horseshoe (GGH). Further east, price growth in Ottawa, Montreal and Moncton continues as it has for some time now, with Montreal and particularly Ottawa having strengthened noticeably in recent months.


Comparing home prices to year-ago levels yields considerable variations across the country, although for the most part trends are still regionally split along east/west lines, with rising gains from Ontario east, and a mixed bag of smaller gains and declines in B.C. and the Prairies.


The actual (not seasonally adjusted) Aggregate Composite MLS® (HPI) rose 4.7% y-o-y in January, the biggest year-over-year gain since February 2018.


Home prices in Greater Vancouver (-1.2%) remain slightly below year-ago levels, but declines are still shrinking. Meanwhile, January saw prices back in positive y-o-y territory in the Fraser Valley (+0.3%). Elsewhere in British Columbia, home prices logged y-o-y increases in the Okanagan Valley (+3.5%), Victoria (+3.4%) and elsewhere on Vancouver Island (+4%).


Calgary, Edmonton and Saskatoon continued to post small y-o-y price declines, while the y-o-y gap has now widened to -6.9% in Regina.


In Ontario, home price growth has re-accelerated across most of the GGH, with a number of markets getting close to double digits. Meanwhile, price gains in recent years have continued uninterrupted in Ottawa (+13.7%), Montreal (+9.8%) and Moncton (+6.4%).


All benchmark home categories tracked by the index accelerated further into positive territory on a y-o-y basis, with similar sized gains among the different property types.


Apartment unit prices posted the biggest y-o-y increase (+5%) followed closely by two-storey single family homes (+4.8%), one-storey single-family homes (+4.4%) and townhouse/row units (+4.2%).


The MLS® HPI provides the best way to gauge price trends, because averages are strongly distorted by changes in the mix of sales activity from one month to the next.


The actual (not seasonally adjusted) national average price for homes sold in January 2020 was around $504,350, up 11.2% from the same month the previous year. This was the largest increase since mid-2016.


The national average price is heavily influenced by sales in the GVA and GTA, two of Canada’s most active and expensive housing markets. Excluding these two markets from calculations cuts close to $110,000 from the national average price, trimming it to around $395,000.


Provided by: CREA

Read

BC Housing Markets Off to a Strong Start in 2020


The British Columbia Real Estate Association (BCREA) reports that a total of 4,426 residential unit sales were recorded by the Multiple Listing Service® (MLS®) in January 2020, an increase of 23.7 per cent from the 3,579 units sold in January 2019. The average MLS® residential price in BC was $725,370, a 9.1 per cent increase from $664,633 recorded the previous year. Total sales dollar volume in January was $3.2 billion, a 35 per cent increase over 2019.


“Housing markets in BC are off to a strong start in 2020,” said BCREA Chief Economist Brendon Ogmundson. “We expect a much more typical year of home sales in 2020 as markets recover from the policy-induced slowdown of the past two years.”

Total MLS® residential active listings fell 12.6 per cent to 25,790 units compared to the same month last year. The ratio of sales to active residential listings increased to 17.2 per cent from just 12.1 per cent last January.

“While many markets are showing strong signs of recovery, the struggling forestry sector is having a clear impact on housing demand, particularly in the North and parts of Vancouver Island,” added Ogmundson.


Click here for more...


Provided by: BCREA


Read

Home sale activity up, supply down to start 2020

Home sale and price activity remained steady in Metro Vancouver* to start 2020 while home listing activity declined in January.


The Real Estate Board of Greater Vancouver (REBGV) reports that residential home sales in the region totalled 1,571 in January 2020, a 42.4 per cent increase from the 1,103 sales recorded in January 2019, and a 22.1 per cent decrease from the 2,016 homes sold in December 2019.


Last month’s sales were 7.3 per cent below the 10-year January sales average.


“We've begun 2020 with steady home buyer demand that tracks close to the region's long-term average,” Ashley Smith, REBGV president said. “Looking at supply, we’re seeing fewer homes listed for sale than is typical for this time of year. As we approach the traditionally more active spring market, we’ll keep a close eye on supply to see if the number of homes being listed is keeping pace with demand.”


There were 3,872 detached, attached and apartment properties newly listed for sale on the Multiple Listing Service® (MLS®) in Metro Vancouver in January 2020. This represents a 20.1 per cent decrease compared to the 4,848 homes listed in January 2019 and a 143.8 per cent increase compared to December 2019 when 1,588 homes were listed.


Last month’s new listings were 17.4 per cent below January’s 10-year average.


The total number of homes currently listed for sale on the MLS® system in Metro Vancouver is 8,617, a 20.3 per cent decrease compared to January 2019 (10,808) and a 0.2 per cent increase compared to December 2019 (8,603), and is 13.7 per cent below the 10-year January average.


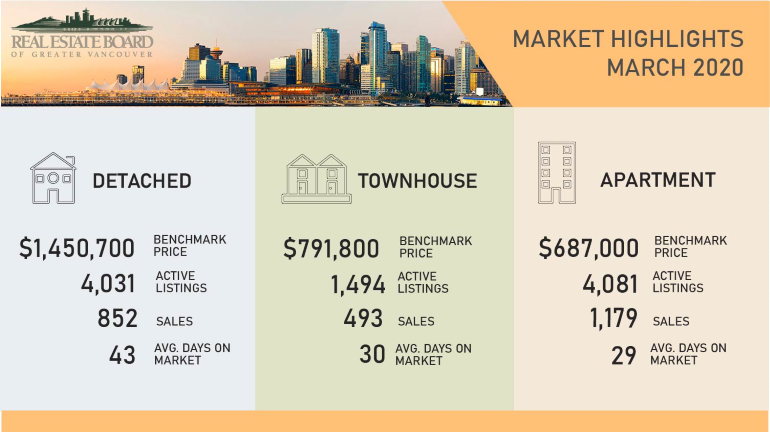
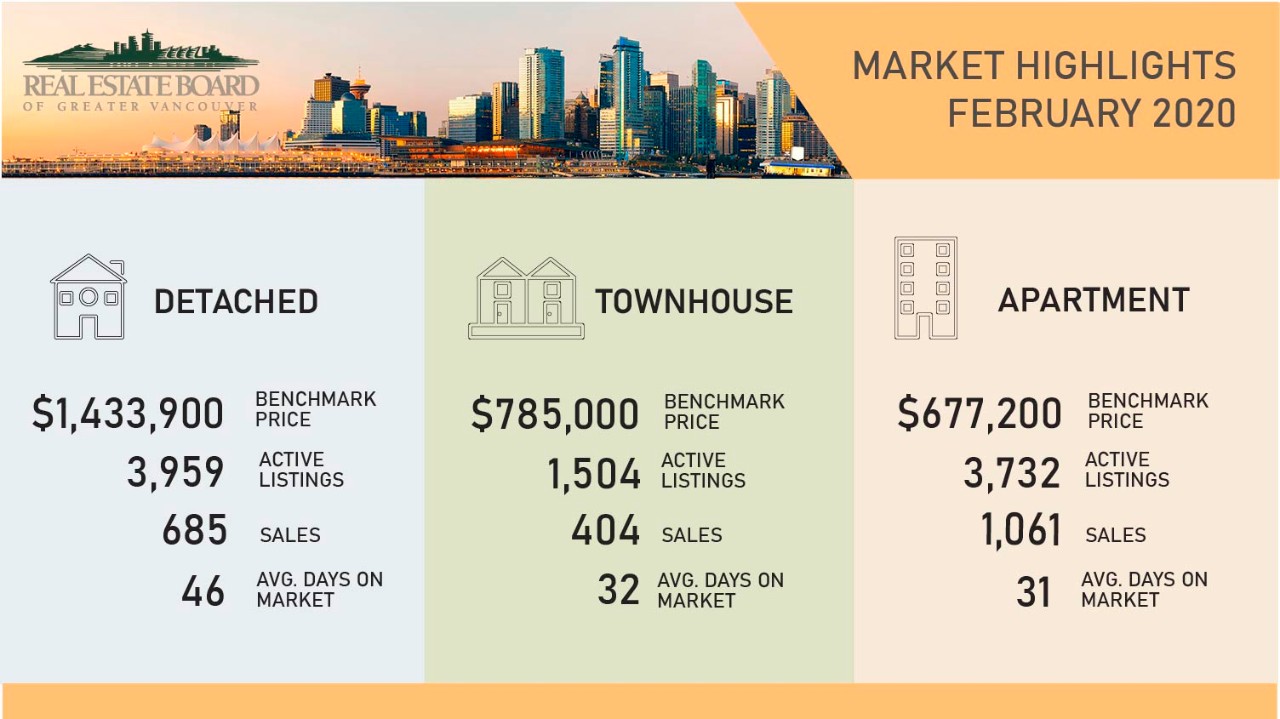
For all property types, the sales-to-active listings ratio for January 2020 is 18.2 per cent. By property type, the ratio is 11.6 per cent for detached homes, 22.6 per cent for townhomes, and 23.9 per cent for apartments.


Generally, analysts say downward pressure on home prices occurs when the ratio dips below 12 per cent for a sustained period, while home prices often experience upward pressure when it surpasses 20 per cent over several months.


The MLS® Home Price Index composite benchmark price for all residential properties in Metro Vancouver is currently $1,008,700. This represents a 1.2 per cent decrease over January 2019, a 1.4 per cent increase over the past six months, and a 0.8 per cent increase compared to December 2019.


Sales of detached homes in January 2020 reached 439, a 29.5 per cent increase from the 339 detached sales recorded in January 2019. The benchmark price for detached properties is $1,431,200. This represents a 1.7 per cent decrease from January 2019, a one per cent increase over the past six months, and a 0.5 per cent increase compared to December 2019.


Sales of apartment homes reached 814 in January 2020, a 45.6 per cent increase compared to the 559 sales in January 2019. The benchmark price of an apartment property is $663,200. This represents a one per cent decrease from January 2019, a 1.5 per cent increase over the past six months, and a one per cent increase compared to December 2019.


Attached home sales in January 2020 totalled 318, a 55.1 per cent increase compared to the 205 sales in January 2019. The benchmark price of an attached unit is $782,500. This represents a 0.7 per cent decrease from January 2019, a 1.6 per cent increase over the past six months, and a 0.5 per cent increase compared to December 2019.


Click here for more...


Provided by: REBGV

Read

Just Sold: 2579 Camberley Crt., Coquitlam, Coquitlam East

Gorgeous 3 Level Home

4 Bedrooms on Top Floor

Price at $1,448,800

Open: Jan 25 from 1 to 3.


Click here for more...


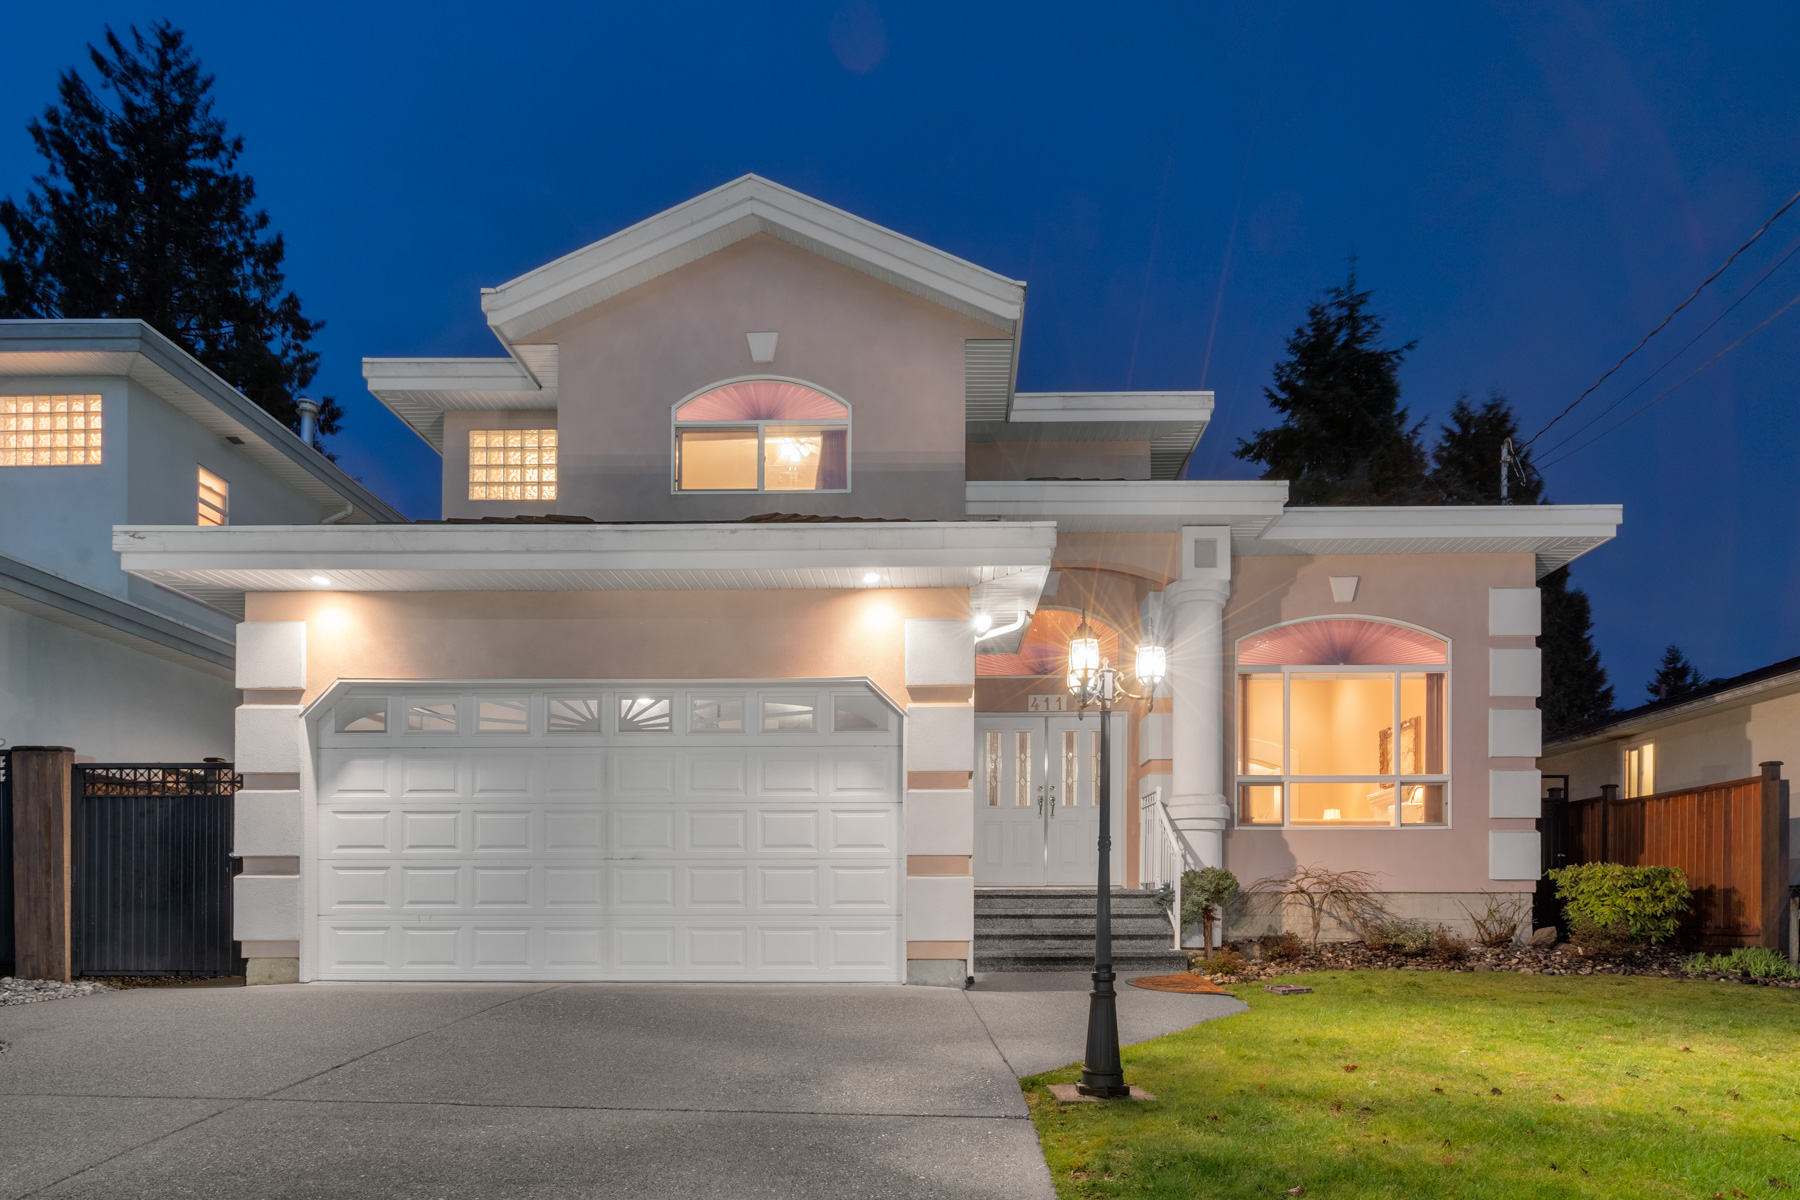
Gorgeous Mnt Baker views. Highly sought 4 bedroom layout. Perched on a cul-de-sac in desirable Coquitlam East, is this tastefully updated home; you won't be disappointed! Beautiful 5bed/4bath/3629sqft/3lvl home on a 7000sqft+ lot complete w/3 mature Palm Trees to call yours. Main: living & dining rooms, den, spacious kitchen w/island & massive family room complete w/private balcony & cozy F/P. Level yard access w/brand new cedar deck, hot tub & fruit trees; entertainer's delight. Up: massive master w/walk-in & 5pc ensuite, 3 excellent sized rooms & main bath. Down: rec room, separate entry, kitchen, bed & 3pc bath; perfect nanny suite. Location: RC McDonald catchment, walk to Starbucks, shopping, restaurants, transit, easy Hwy 1 access & more. Act Now! Open Jan 25 from 1 to 3.

Read

As we enter 2020, it’s important to look back on important trends in the housing market from 2019 to see how the coming year might shape up.


Let’s take a look at the top 5 lessons learned from 2019 and the market outlook for 2020 to ensure you are best positioned to support homebuyers in the coming year.

1. Housing activity expected to recover in 2020

According to CMHC’s latest Housing Market Outlook, housing sales, starts and price growth declined in 2018 – 2019 after reaching elevated levels in 2017. We are expecting to see a recovery of housing activity in 2020 because of overall economic and demographic conditions and income growth.


Three areas where the market will recover:

  • Housing sales will start recovering in 2020, offsetting recent declines.
  • Positive price growth to resume in 2020, driving the average price above its 2017 level.
  • Housing starts will stabilize in 2020.

2. Renovations and refinancing in a low-interest rate environment

According to CMHC’s 2019 Mortgage Consumer Survey, many homebuyers plan to renovate their home in the near future.  More than 6-in-10 homebuyers (63%) plan to renovate within 5 years.


Many Canadians refinance their homes in order to renovate. Sixty-one per cent of refinancers were currently renovating their home in 2019, compared to only 23% in 2018. Refinancing a home for renovations was the 2nd highest reason for refinancing.


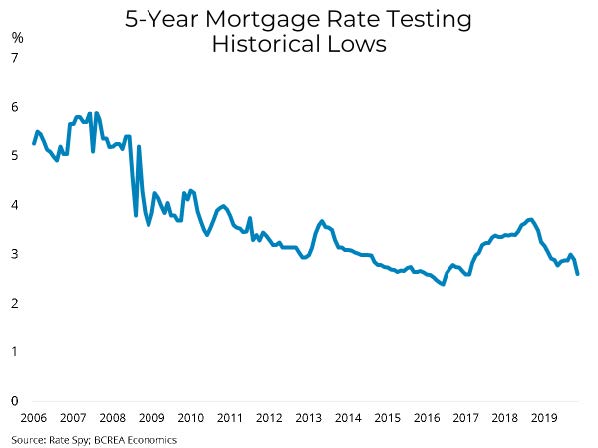
This information is very relevant when we consider that mortgage rates are expected to remain at low levels and an increasing numbers of buyers are betting that interest rates won’t rise again anytime soon.


Keep this in mind when assisting clients looking to renovate their homes.

3. Homebuyers focused on price and affordability

As we move into 2020 and we expect to see an increase in housing sales, it’s important for you to know what homebuyers are looking for. If the trends continue, then homebuyers in 2020 will prioritize price and affordability over a number of other factors when looking for their new home.


We asked Canadians what they felt were their “wants” and “needs” when it came to buying a home. The top three “must-haves” were:

  • Price/Affordability
  • Number of rooms
  • Proximity to public transit

A newly-built home ranked at the bottom of the “needs” of 2019 homebuyers and a “move-in-ready” home also dropped significantly compared to previous years.

4. Consumer habits going into 2020

There was a significant decrease in buyers paying the maximum amount they could afford in 2019. Sixty percent of homebuyers bought the highest priced home they could afford, down from 78% in 2018. 


Sixty one percent of homebuyers impacted by the new mortgage rules (or “stress test”) reacted by purchasing a smaller or less expensive home compared to 47% in 2018.


Heading into 2020, you can prepare for a market where more and more Canadians are stretching their dollar and making financial changes to afford their home.

5. Homes sales will increase, and so will the need for good advice

An important trend from 2019 was the clear uncertainty about the home buying process amongst homebuyers. Forty two percent of 2019 buyers said they felt concerned or were uncertain about the process of buying a home, a jump from 37% in 2018.


Additionally, 2019 saw a strong increase in buyers’ perception of the value of working with a real estate agent, rising from 28% of buyers in 2018 to 35% in 2019.


If this trend continues into 2020, then the importance of mortgage and real estate professionals, particularly in an environment of increasing sales and rising prices, will be even more important.


Provided by: CMHC

Read

When we decided we were ready to purchase our first home, we were excited and terrified all at the same time. Hafez took the time to explain the entire process to us and gave us realistic expectations. Hafez was prompt and thorough which allowed us to find the absolute perfect first home for us in only a short period of time. The energy he put in to meet our needs made us feel like we were his top priority and treated us warmly with open arms. Hafez is genuinely kind and made us feel like it was not just a transaction but a memorable mile stone in our lives. We really appreciate his support during this big decision in our lives and truly believe we will work with him again in the future.


C. & N.

Read

Just Listed: 402 22722 Lougheed Hwy., Maple Ridge, East Central

Fully Renovated

Top Floor

Price at $298,800

Open: Feb 1, from 2 to 4


Click here for more...


Top floor, extensively renovated, green space facing, centrally located; your search ends here. This massive 1bed/1bath/851sqft West facing home, located in Mark's Place of East Central Maple Ridge, will not disappoint! Upgrades: fresh paint, brand new carpet & vinyl floors, LED light fixtures, new faucets, new closet doors & brushed nickel hardware, upgraded bathroom w/vanity, lighting & mirror, new fireplace surround; nothing to do but move right in. Features: large living & dining areas, spacious kitchen w/plenty of cupboard & counter space & eating area, covered balcony, functional laundry rm & plenty of storage space. Enjoy the huge master w/lots of closet space & access to balcony. Close to: shopping, recreation, transit, parks & schools. Act Now! Open Feb 1 from 2 to 4.

Read

Just Sold: 202 1432 Parkway Blvd., Coquitlam, Westwood Plateau


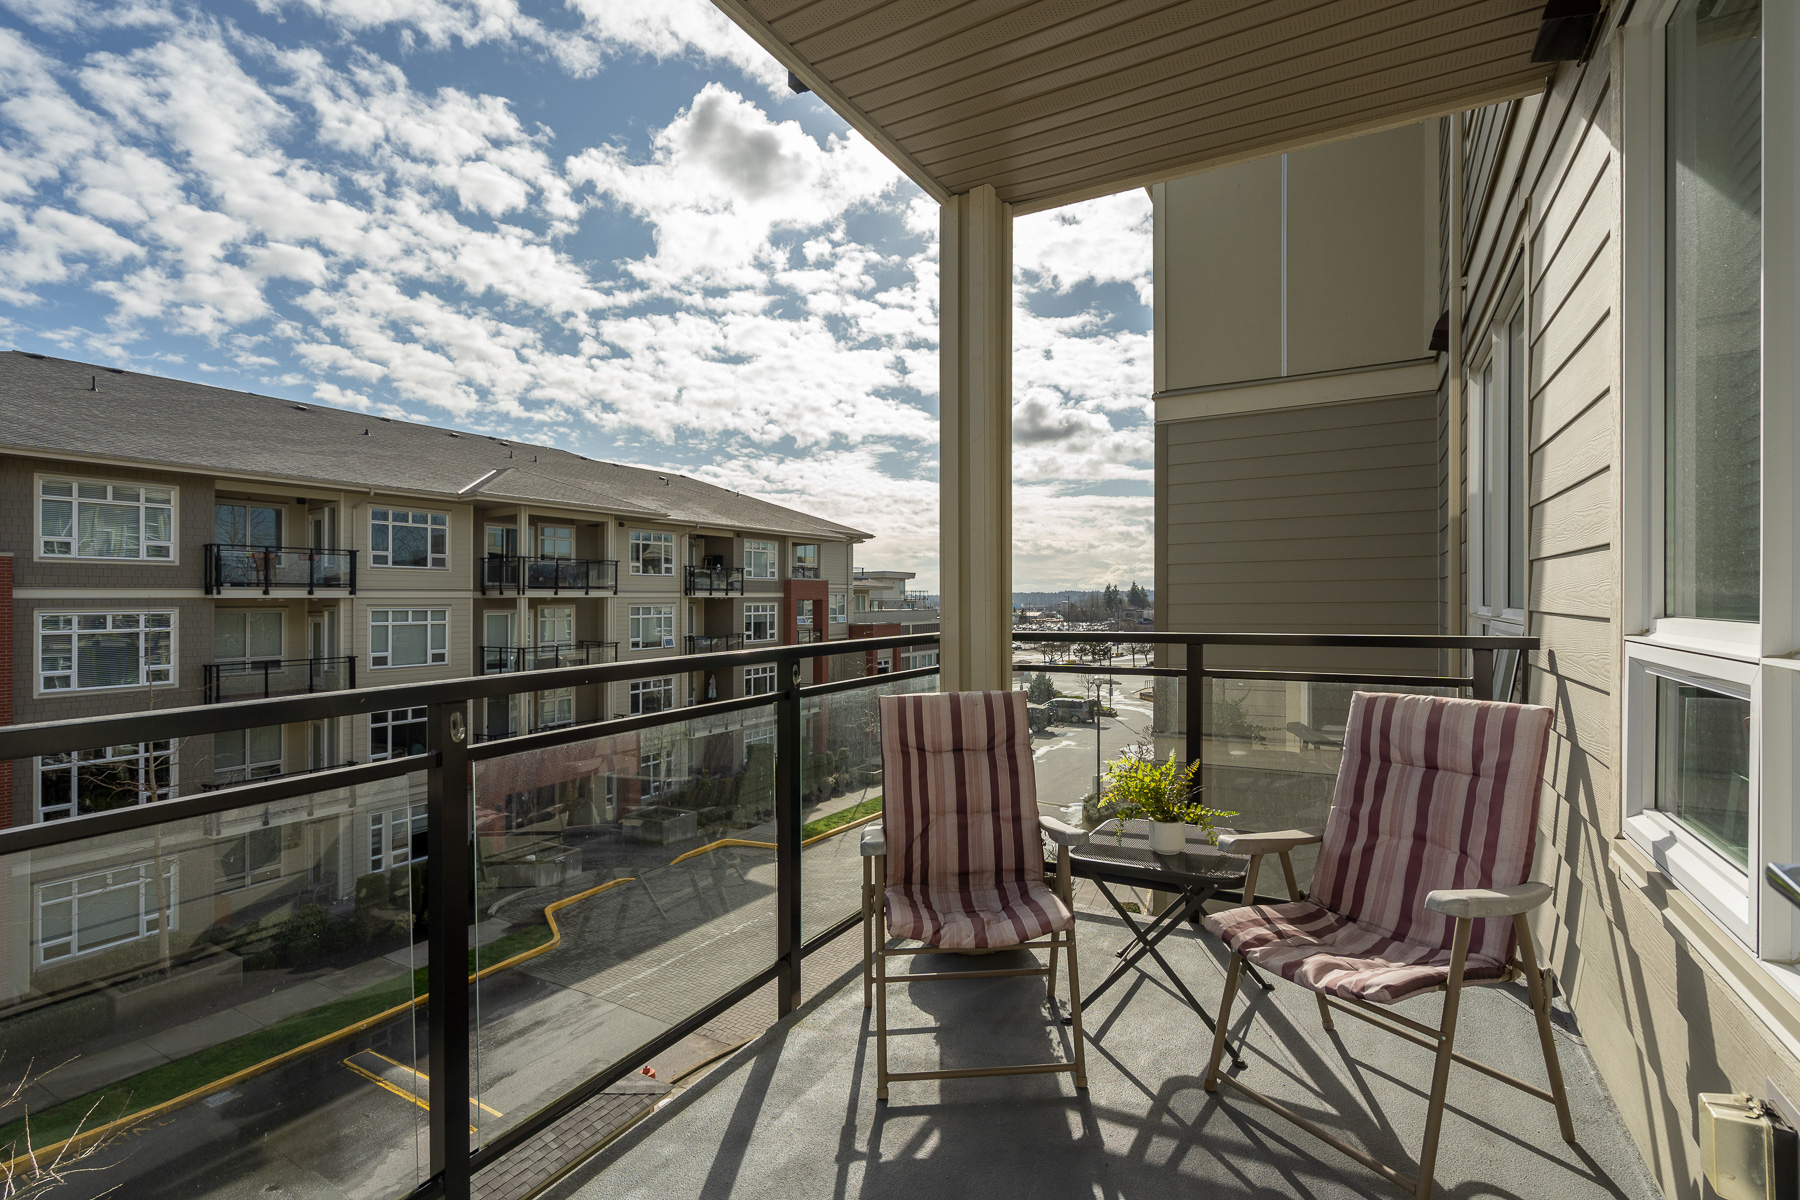
Cancel the Gym Membership! This stunning, spacious two bedroom, two bath apartment complex has a outdoor pool, hot tub and exercise room. Bright and spacious unit with a gorgeous view off the covered deck of Mount Baker, this will tick a lot of the boxes. Laminate flooring throughout, granite counters in the kitchen, gas fireplace with new facing, two parking spots side by side. There are 2 pets allowed 1 dog and 1 cat or 2 cats. Conveniently situated, close to schools, transit (buses and Evergreen line) and shopping just down the hill at Coquitlam Center. Excellent condition, new roof (2 year project just completed) and strata fee includes gas and hot water. Hurry, its a great opportunity knocking - Don't miss out!


Listing Offered by: Royal LePage Brookside Realty

Read

BC Homes Sales Carry Momentum into 2020


BCREA 2020 First Quarter Housing Forecast Update


The British Columbia Real Estate Association (BCREA) released its 2020 First Quarter Housing Forecast Update today.


Multiple Listing Service® (MLS®) residential sales in the province are forecast to increase 10.3 per cent to 85,290 units this year, after recording 77,349 residential sales in 2019. MLS® residential sales are forecast to increase 6.3 per cent to 90,700 units in 2021.


“The outlook for home sales in 2020 is considerably brighter than the past two years,” said Brendon Ogmundson, BCREA Chief Economist. “Momentum carried through from the end of 2019 to 2020 will put the housing market on more solid footing, aided by low interest rates and an improving economy.”


While demand is recovering, the supply of homes for sale has not managed to keep pace. New listings activity did not materially increase during the downturn in home sales, and total inventory did not accumulate to the same extent as in prior slowdowns. As a result, market conditions around the province are tightening and home prices will likely face upward pressure as demand continues to firm. In 2020, we expect the MLS® average price will rise 4.8 per cent to $734,000.


Click here for more...


Provide by: BCREA

 “Copyright British Columbia Real Estate Association. Reprinted with permission.”

Read


In 2 days, Hafez has done more work than another agent has done for us in a month!


As soon as we asked Hafez to be our listing agent, things went so fast! He is so motivated, organized and doesn’t waste any time to get you a buyer and negotiates the best deal for you! Yes, because of Hafez, we got a great prize for our place with some extras!


Hafez is a great listener, very knowledgeable and an action taker. With Hafez, you don’t have to worry about selling your place fast. He will make sure you get the best value in a short period of time and organizes all details for your best interests.


We were extremely happy with his work and recommend Hafez to anybody who wants to sell their place professionally and fast.


R. & B. B

Read
Reciprocity Logo The data relating to real estate on this website comes in part from the MLS® Reciprocity program of either the Greater Vancouver REALTORS® (GVR), the Fraser Valley Real Estate Board (FVREB) or the Chilliwack and District Real Estate Board (CADREB). Real estate listings held by participating real estate firms are marked with the MLS® logo and detailed information about the listing includes the name of the listing agent. This representation is based in whole or part on data generated by either the GVR, the FVREB or the CADREB which assumes no responsibility for its accuracy. The materials contained on this page may not be reproduced without the express written consent of either the GVR, the FVREB or the CADREB.