RSS

Just Listed: 202 501 Cochrane Ave., Coquitlam, Coquitlam West

Awesome Central Location

Almost 1000 SQFT

Open: Jan. 25 from 2 to 4

Price at $549,900


Click here for more..


HOT DEAL ALERT! "KILLER" location! Fantastic layout! Oh, and ripe for re-development! Have we got your attention yet? This bright, west facing, 2 bed, 1 bath, 996sqft home will not disappoint Features: brand new bedroom carpets, laminate floors in living & dining areas, open living/dining rooms, kitchen with SS appliances & plenty of cupboard & counter space, in suite storage & a cozy gas F/P. The larger master has excellent closet space and the second bedroom is well sized. Bonus: parking and locker. Located in the heart of Burnaby/Coquitlam boarder, stone’s throw to: transit, Skytrain, shopping, recreation, schools and every amenity you can think of. Act Now! Open Sat. Jan. 25 from 2 to 4.

Read

Just Listed: 2579 Camberley Crt., Coquitlam, Coquitlam East

Gorgeous 3 Level Home

4 Bedrooms on Top Floor

Price at $1,448,800

Open: Jan 25 from 1 to 3


Click here for more...


Gorgeous Mnt Baker views. Highly sought 4 bedroom layout. Perched on a cul-de-sac in desirable Coquitlam East, is this tastefully updated home; you won't be disappointed! Beautiful 5bed/4bath/3629sqft/3lvl home on a 7000sqft+ lot complete w/3 mature Palm Trees to call yours. Main: living & dining rooms, den, spacious kitchen w/island & massive family room complete w/private balcony & cozy F/P. Level yard access w/brand new cedar deck, hot tub & fruit trees; entertainer's delight. Up: massive master w/walk-in & 5pc ensuite, 3 excellent sized rooms & main bath. Down: rec room, separate entry, kitchen, bed & 3pc bath; perfect nanny suite. Location: RC McDonald catchment, walk to Starbucks, shopping, restaurants, transit, easy Hwy 1 access & more. Act Now! Open Jan 25 from 1 to 3.

Read

Just Listed: 1611 Manning Ave.,Port Coquitlam, Birchland Manor


Excellent potential opportunity to build a single family home with coach house. Rezoning under way with the City. Currently zoned RD (duplex) with proposal already under review to rezone to RS4. 3rd Reading at the City has been issued. Desirable central location, close to transit, shops, Lougheed Hwy, schools and much more. Features: 35'8122', 4021sqft level lot with lane access and already cleared. Act Now!


Click here for more...

Read

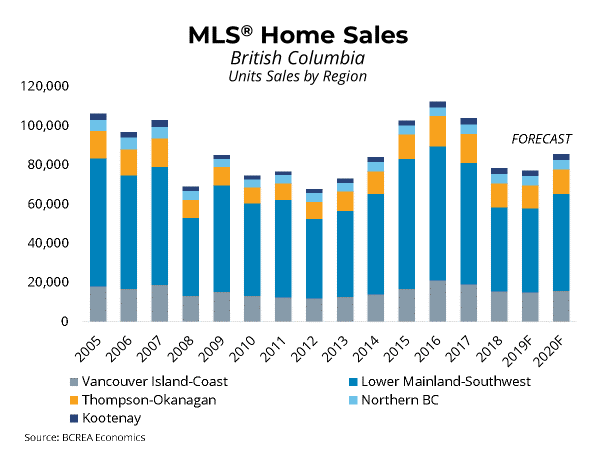
Housing Markets Flat in 2019 After Strong Second Half


The British Columbia Real Estate Association (BCREA) reports that a total of 77,331 residential unit sales were recorded by the Multiple Listing Service® (MLS®) in 2019, a decline of 1.5 per cent from the 78,516 units sold in 2018. The annual average MLS® residential price in BC was $700,460, a decline of 1.6 per cent from $711,564 recorded the previous year. Total sales dollar volume was $54.2 billion, a 3 per cent decline from 2018.


“Housing markets across the province staged a strong recovery in the second half of 2019,” said BCREA Chief Economist Brendon Ogmundson. “This sets up 2020 to be a much more typical year than what markets have experienced recently.”

A total of 5,218 MLS® residential unit sales were recorded across the province in December, up 48.9 per cent from December 2018. The average MLS® residential price in BC was $755,165, an increase of 8.7 per cent from December 2018.


Total sales dollar volume was $3.9 billion, a 61.8 per cent increase year-over-year. Total active residential listings were down 10.6 per cent to 24,691 units in December. Total inventory of homes for sale have declined more than 10 per cent on a year-overyear basis for two straight months.


Click here for more...


Provided by: BCREA

Read

Canadian Housing Starts Trended Lower in December

The trend in housing starts was 212,160 units in December 2019, compared to 219,921 units in November 2019, according to Canada Mortgage and Housing Corporation (CMHC). This trend measure is a six-month moving average of the monthly seasonally adjusted annual rates (SAAR) of housing starts.


“The national trend in housing starts decreased in December,” said Bob Dugan, CMHC's chief economist. “The declines are primarily led by lower-trending multi-family starts in Toronto, Montreal and Ottawa. However, the stable starts at year-end in Vancouver and significant growth in Calgary helped to partially offset the declines in other major centres.”

CMHC uses the trend measure as a complement to the monthly SAAR of housing starts to account for considerable swings in monthly estimates and obtain a more complete picture of Canada’s housing market. In some situations, analyzing only SAAR data can be misleading, as they are largely driven by the multi-unit segment of the market which can vary significantly from one month to the next.


The standalone monthly SAAR of housing starts for all areas in Canada was 197,329 units in December, a decrease of 3% from 204,320 units in November. The SAAR of urban starts decreased by 4% in December to 185,934 units.


Multiple urban starts decreased by 5% to 138,049 units in December while single-detached urban starts increased by 1% to 47,885 units.

Rural starts were estimated at a seasonally adjusted annual rate of 11,395 units.


Click here for more...


Provided by: CMHC

Read

Just Sold: 1511 Haversley Ave., Coquitlam, Central Coquitlam


Wonderful New Home at $2,168,000. 1511 Haversley is the newest star & the finest new home with over 6,000 sqft., of amazing space- 3 foors, 8 bdrms. plus office & 8 baths. An exquisite layout with flex options for the multi-generational family including a main floor bedroom with ensuite bath & legal 2 bdrm Suite. One of the larger new homes on the market yet comfortable & balanced. Highlights include 2 great rooms, deluxe kitchen, theatre room, spice kitchen, full appliance package & much more! .“Rental can cover a $750,000 mortgage!” Located in sought after ‘Central Coquitlam’, this fab home is at the heart of all amenities from Como Lake Village, Poirier Rec Centre, major shops & short drive to SFU. Peace of mind with 2-5-10 Year national warranty by experienced Coquitlam builder.


Listing offered by: Re/Max Crest Realty

Read

Just Listed: 1690 Cameron Ave.,Port Coquitlam, Lower Mary Hill


CALLING ALL BUILDERS AND RENOVATORS!


Click here for more...


Looking for a family-oriented neighborhood that is mature, desirable, close to parks, recreation, schools, transit, HWY access and much more? Then look no further. We have the deal for you. Priced to move based on condition. This two level, 4 bed, 2 bath, 1977sqft home sits on a level 4137sqft lot in Lower Mary Hill sub-area of Port Coquitlam. Surrounded by a mix of newer and older well-cared for homes, this can be an excellent opportunity. Renovate and move-in, renovate and fill, add some TLC and rent it out, or tear down and build. Take your pick. Either way, call today for your private viewing. Act Now!

Read

Home sales decline below long-term averages in 2019 despite increased demand to end the year


The Metro Vancouver* housing market experienced below average sales activity and moderate price declines in 2019.


The Real Estate Board of Greater Vancouver (REBGV) reports that sales of detached, attached and apartment homes reached 25,351 in 2019, a three per cent increase from the 24,619 sales recorded in 2018, and a 29.6 per cent decrease over the 35,993 residential sales in 2017.


Last year’s sales total was 20.3 per cent below the region’s 10-year sales average.


“We didn’t see typical seasonal patterns in 2019.Home buyer demand was quieter in the normally busy spring season and it picked up in the second half of the year,” Ashley Smith, REBGV president said. “In terms of home values, prices dipped between two and four per cent across the region last year depending on property type.”


Home listings on the Multiple Listing Service® (MLS®) in Metro Vancouver reached 51,918 in 2019. This is a 3.2 per cent decrease compared to the 53,614 homes listed in 2018 and a five per cent decrease compared to the 54,655 homes listed in 2017.


Last year’s listings total was 7.6 per cent below the 10-year average.


“Home buyer confidence was a factor throughout the year. In the first quarter, many prospective buyers were in a holding pattern, waiting to see how prices would react to the mortgage stress test, new taxes, and other policy changes,” Smith said. “Confidence started to return in the summer, and we saw above average sales in the final quarter of 2019.”


The MLS® HPI composite benchmark price for all residential properties in Metro Vancouver ends the year at $1,001,000. This is a 3.1 per cent decrease compared to December 2018.


The benchmark price of apartments decreased 2.7 per cent in the region last year. Townhomes decreased 2.4 per cent and detached homes decreased four per cent.


December summary

REBGV reports that residential home sales in the region totalled 2,016 in December 2019, an 88.1 per cent increase from the 1,072 sales recorded in December 2018, and a 19.3 per cent decrease from the 2,498 homes sold in November 2019.


Last month’s sales were 9.5 per cent above the 10-year December sales average.


There were 1,588 detached, attached and apartment properties newly listed for sale on the MLS® in Metro Vancouver in December 2019. This represents a 12.9 per cent increase compared to the 1,407 homes listed in December 2018 and a 46.8 per cent decrease compared to November 2019 when 2,987 homes were listed.


The total number of homes currently listed for sale on the MLS® system in Metro Vancouver is 8,603, a 16.3 per cent decrease compared to December 2018 (10,275) and a 20.1 per cent decrease compared to November 2019 (10,770).


For all property types, the sales-to-active listings ratio for December 2019 is 23.4 per cent. By property type, the ratio is 15.2 per cent for detached homes, 25.7 per cent for townhomes, and 32.5 per cent for apartments.


Generally, analysts say that downward pressure on home prices occurs when the ratio dips below 12 per cent for a sustained period, while home prices often experience upward pressure when it surpasses 20 per cent over several months.


Sales of detached homes in December 2019 reached 599, a 72.1 per cent increase from the 348 detached sales recorded in December 2018. The benchmark price for detached properties is $1,423,500. This represents a four per cent decrease from December 2018, and a 0.6 per cent increase compared to November 2019.


Sales of apartment homes reached 1,053 in December 2019, a 96.8 per cent increase compared to the 535 sales in December 2018. The benchmark price of an apartment property is $656,700. This represents a 2.7 per cent decrease from December 2018, and a 0.8 per cent increase compared to November 2019.


Attached home sales in December 2019 totalled 364, a 92.6 per cent increase compared to the 189 sales in December 2018. The benchmark price of an attached home is $778,400. This represents a 2.4 per cent decrease from December 2018, and a 0.7 per cent increase compared to November 2019.


Click here for more...


Provided by: REBGV

Read

JUST Sold: 304 2477 Kelly Ave, Port Coquitlam

Don't look any further! This beautiful 2 bedroom, 2 bathroom, corner unit is finally available for you! Giving you all the feels of a New York condo, This unit overlooks Gates Park with oversized windows and unobstructed views. The large open concept kitchen w/Granite counter tops is perfect for hosting. Stainless steel appliances, Large 4 piece Master Bathroom. Excellent location! Close to transit, Elementary, Middle, and High school, Restaurants, Shops, and the highly anticipated Port Coquitlam Community Center. Book your private viewing today!


Listing provided by: RE/MAX LifeStyles Realty

Read

Canadian home sales edge higher in November


Statistics released today by the Canadian Real Estate Association (CREA) show national home sales continued to edge higher in November 2019.

Highlights:

  • National home sales rose 0.6% month-over-month (m-o-m) basis in November.
  • Actual (not seasonally adjusted) activity was up 11.3% year-over-year (y-o-y).
  • The number of newly listed properties dropped by 2.7% m-o-m.
  • The MLS® Home Price Index (HPI) advanced by 0.8% m-o-m and 2.6% y-o-y.
  • The actual (not seasonally adjusted) national average sale price climbed 8.4% y-o-y.

Home sales recorded via Canadian MLS® Systems inched up by 0.6% November 2019. Notching its ninth straight monthly gain, activity stands 20% above the six-year low reached in February 2019 but 6% to 7% below heights recorded in 2016 and 2017.


There was an almost even split between the number of local markets where activity rose and those where it declined. Higher sales across much of British Columbia and in the Greater Toronto Area (GTA) offset a decline in activity in Calgary.


Actual (not seasonally adjusted) activity was up 11.3% year-over-year in November. Transactions surpassed year-ago levels in almost all of Canada’s largest urban markets.


“Sales continue to improve in some regions and not so much in others,” said Jason Stephen, president of CREA. “The mortgage stress-test doesn’t help relieve the ongoing shortage of housing in markets where sales have improved, and it continues to hammer housing demand in markets with ample supply. All real estate is local, and nobody knows that better than a professional REALTOR®, your best source for information and guidance when negotiating the sale or purchase of a home,” said Stephen.


“Home prices look set to continue rising in housing markets where sales are recovering amid an ongoing shortage of supply,” said Gregory Klump, CREA’s Chief Economist. “By the same token, home prices will likely continue trending lower in places where there’s a significant overhang of supply, perpetuated in part by the B-20 mortgage stress-test that continues to sideline homebuyers there.”


The number of newly listed homes slid a further 2.7%, putting them among the lowest levels posted in the past decade. November’s decline was driven primarily by fewer new listings in the GTA.


Slightly higher sales and a drop in new listings further tightened the national sales-to-new listings ratio to 66.3%, which is well above the long-term average of 53.7%. If current trends continue, the balance between supply and demand makes further home price gains likely.


Considering the degree and duration to which market balance readings are above or below their long-term averages is the best way of gauging whether local housing market conditions favour buyers or sellers. Market balance measures that are within one standard deviation of their long-term average are generally consistent with balanced market conditions.


Based on a comparison of the sales-to-new listings ratio with the long-term average, just over half of all local markets were in balanced market territory in November. That list includes the GTA and Lower Mainland of British Columbia, but market balance there is tightening. By contrast, an oversupply of homes relative to demand across much of Alberta and Saskatchewan means sales negotiations remain tilted in favour of buyers.


Meanwhile, an ongoing shortage of supply of homes available for purchase across most of Ontario, Quebec and the Maritime provinces means sellers there hold the upper hand in sales negotiations. The number of months of inventory is another important measure of the balance between sales and the supply of listings. It represents how long it would take to liquidate current inventories at the current rate of sales activity.


There were just 4.2 months of inventory on a national basis at the end of November 2019 – the lowest level recorded since the summer of 2007. This measure of market balance has been retreating further below its long-term average of 5.3 months. While still just within balanced market territory, its current reading suggests that sales negotiations are becoming increasingly tilted in favour of sellers.


National measures of market balance continue to mask significant and increasing regional variations. The number of months of inventory has swollen far beyond long-term averages in Prairie provinces and Newfoundland & Labrador, giving homebuyers ample choice in these regions. By contrast, the measure is running well below long-term averages in Ontario, Quebec and Maritime provinces, resulting in increased competition among buyers for listings and providing fertile ground for price gains. The measure is still within balanced market territory in the Lower Mainland of British Columbia but is becoming increasingly tilted in favour of sellers.


The Aggregate Composite MLS® Home Price Index (MLS® HPI) rose 0.8%. Marking its sixth consecutive monthly gain, it now stands almost 4% above its low point reached last May.


The MLS® HPI in November was up from the previous month in 14 of the 18 markets tracked by the index.

Home price trends have generally been stabilizing in the Prairies in recent months.


While that remains the case in Calgary, Edmonton and Saskatoon, prices in Regina have again moved lower. By contrast, home price trends have clearly started to recover in the Lower Mainland of British Columbia. Meanwhile, prices continue to rebound in the Greater Golden Horseshoe (GGH) region while continuing to trend higher in housing markets to the east of it.


Comparing home prices to year-ago levels yields considerable variations across the country, with a mix of gains and declines in western Canada together with price gains in eastern Canada.


The actual (not seasonally adjusted) Aggregate Composite MLS® (HPI) was up 2.6% y-o-y in November 2019, the biggest year-over-year gain since March 2018.


Home prices in Greater Vancouver (-4.6%) and the Fraser Valley (-2.9%) remain below year-ago levels but declines are shrinking. Elsewhere in British Columbia, home prices logged y-o-y increases in the Okanagan Valley (+1.4%), Victoria (+1.5%) and elsewhere on Vancouver Island (+2.8%).


Calgary, Edmonton and Saskatoon posted price declines of around -2% y-o-y, while the gap widened to-5.5% y-o-y in Regina.


In Ontario, price growth has re-accelerated well ahead of overall consumer price inflation across most of the GGH. Meanwhile, price growth in recent years has continued uninterrupted in Ottawa, Montreal and Moncton.


All benchmark home categories tracked by the index accelerated further into positive territory on a y-o-y basis. Two-storey single-family home prices posted the biggest increase, rising 2.8% y-o-y. Price gains were almost as strong for apartment units (+2.6% y-o-y) and one-storey single family homes (+2.5% y o y), while townhouse/row prices climbed a more modest 1.5% compared to November 2018.


The MLS® HPI provides the best way to gauge price trends, because averages are strongly distorted by changes in the mix of sales activity from one month to the next.


The actual (not seasonally adjusted) national average price for homes sold in November 2019 was around $529,000, up 8.4% from the same month last year.


The national average price is heavily skewed by sales in the GVA and GTA, two of Canada’s most active and expensive housing markets. Excluding these two markets from calculations cuts almost $125,000 from the national average price, trimming it to around $404,000 and reducing the year-over-year gain to 6.9%.


Provided by: CREA

Read

Home Sales Firming Across the Province

The British Columbia Real Estate Association (BCREA) reports that a total of 6,616 residential unit sales were recorded by the Multiple Listing Service® (MLS®) in November, an increase of 27.5 per cent from the same month last year. The average MLS® residential price in the province was $746,939, an increase of 5.5 per cent from November 2018. Total sales dollar volume was $4.94 billion, a 34.4 per cent increase from the same month last year.


“After several months of strong gains, home sales are now firming around long-run averages,” said BCREA Chief Economist Brendon Ogmundson. “We expect 2020 will be a much more typical year for markets compared to the volatility of recent years.”


MLS® residential active listings in the province were down 6.6 per cent from November 2018 to 31,310 units, and down for a seventh straight month on a seasonally adjusted basis. Overall market conditions remain balanced with a sales-to-active listings ratio of 21 per cent.


Year-to-date, BC residential sales dollar volume was down 6 per cent to $50.23 billion, compared with the same period in 2018. Residential unit sales were 3.9 per cent lower at 72,106 units, while the average MLS® residential price was down 2.2 per cent year-todate at $696,574.


Click here for more...


Provided by: BCREA

Read
Reciprocity Logo The data relating to real estate on this website comes in part from the MLS® Reciprocity program of either the Greater Vancouver REALTORS® (GVR), the Fraser Valley Real Estate Board (FVREB) or the Chilliwack and District Real Estate Board (CADREB). Real estate listings held by participating real estate firms are marked with the MLS® logo and detailed information about the listing includes the name of the listing agent. This representation is based in whole or part on data generated by either the GVR, the FVREB or the CADREB which assumes no responsibility for its accuracy. The materials contained on this page may not be reproduced without the express written consent of either the GVR, the FVREB or the CADREB.