RSS

The author of Millionaire Migrants was one the first to provide evidence that the foreign real-estate dreams of China’s wealthy have arguably had more impact than anything on Metro Vancouver’s housing unaffordability.


UBC geographer David Ley, along with SFU’s Wu Qiyan, told me early this year the city’s real-estate bubble would be punctured when leaders of the People’s Republic of China further restrict money leaving their country.


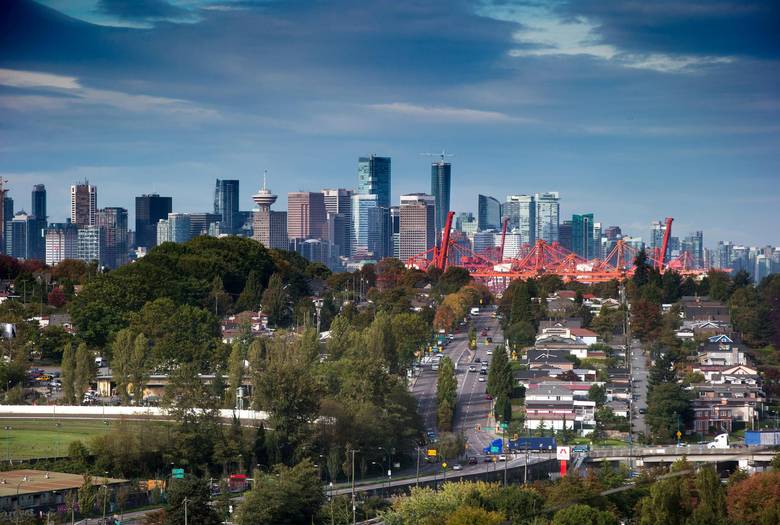
Now strong signs are appearing that Metro Vancouver’s real-estate balloon has indeed been pricked by China’s heightened capital controls.


Demand for multi-million dollar dwellings in Metro Vancouver is falling. “All the high-end stuff is sluggish,” says Vancouver realtor-analyst Steve Saretsky.


Sales volumes and prices on detached houses are especially dropping on the west side of Vancouver, in Richmond and in West Vancouver, where Mainland Chinese buyers had been active buying and building mansions.


Real Estate Association of Greater Vancouver figures show the median price of a detached home is down more than $500,000 since February, to $1.7 million.


(The declining demand for detached homes counters a run on one-bedroom condos in Metro Vancouver. Like others, Saretsky believes these small-condo purchases are not particularly tied to Mainland Chinese investors.)


Veteran Canadian real-estate data analyst Stephen Punwasi also has little doubt “Chinese capital is having a tougher time getting out of China” since leaders introduced tighter controls in January.


“Vancouver locals selling $3 million bungalows are going to have trouble finding an alternative to foreign urban land buyers, so prices need to be slashed,” Punwasi said.


The co-founder of Better Dwelling, which specializes in housing data, said the volume of “hot money” leaving China in August has plummeted almost 40 per cent compared to August last year, to roughly $46 billion US. This is the kind of cash that typically goes into foreign real estate.


Ley is also convinced low and medium-wealthy Chinese investors are being “bitten” by China’s new controls.


However, Ley cautions that many of China’s super-wealthy “have already moved a lot of capital outside the P.R.C.” into trust funds, offshore tax havens and secret bank accounts.


Even though Chinese and other foreign capital will continue to flow into Metro Vancouver and Toronto — with unpredictably destructive effect for locals — the phenomenally high volume of detached-home sales of the past few years is seriously easing.


Provided by: Douglas Todd from MSN Money

Read

6 Bed Home w/Basement Suite

Desirable Family Neighborhood

Price at $1,198,800

Open: Sat Oct 7 from 1 to 3


Perfect family home in desirable Hockaday area of Coquitlam. Well maintained, huge 3 car-garage, level lot, 1 bed suite; your search is finally over! This 6bed/3bath/2lvl/2691sqft home sits on a level 6000sqft fenced lot backing onto a lush forest backdrop. Main level features expansive windows, laminate floors, spacious living & dinning rooms, large kitchen w/SS apps & eating area & perfectly sized BBQ deck. The large master w/walkin & ensuite, 3 well sized rooms & 4pc bath complete this level. Down: 1 bed for main living, laundry area, garage access & bright, large, above ground suite w/separate ent.  Bonus: freshly painted throughout main home, new blinds, 5yr young roof & 1yr young fence. Act Now! OPEN HOUSE Sat Oct 7 from 1 to 3.


Read

Apartment and townhome activity is outpacing the detached home market across Metro Vancouver*. This activity helped push total residential sales above the historical average in September.


The Real Estate Board of Greater Vancouver (REBGV) reports that residential property sales in the region totalled 2,821 in September 2017, a 25.2 per cent increase from the 2,253 sales recorded in September 2016, and a 7.3 per cent decrease compared to August 2017 when 3,043 homes sold.


Last month’s sales were 13.1 per cent above the 10-year September sales average.


“Our detached homes market is balanced today, while apartment and townhome sales remain in sellers' market territory,” Jill Oudil, REBGV president said. “If you’re looking to enter the market, as either a buyer or seller, it’s important to understand these trends and use this information to set realistic expectations.”


There were 5,375 detached, attached and apartment properties newly listed for sale on the Multiple Listing Service® (MLS®) in Metro Vancouver in September 2017. This represents a 12 per cent increase compared to the 4,799 homes listed in September 2016 and a 26.6 per cent increase compared to August 2017 when 4,245 homes were listed.


The total number of homes currently listed for sale on the MLS® system in Metro Vancouver is 9,466, a 1.2 per cent increase compared to September 2016 (9,354) and a 7.5 per cent increase compared to August 2017 (8,807).


“Detached homes made up 30 per cent of all sales in September and represented 62 per cent of all the homes listed for sale on the MLS®,” said Oudil. “This dynamic has slowed the pace of upward pressure that we’ve seen on detached home prices in our market over the last few years.”


For all property types, the sales-to-active listings ratio for September 2017 is 29.8 per cent. By property type, the ratio is 14.6 per cent for detached homes, 42.3 per cent for townhomes, and 60.4 per cent for apartments.


Generally, analysts say that downward pressure on home prices occurs when the ratio dips below the 12 per cent mark for a sustained period, while home prices often experience upward pressure when it surpasses 20 per cent over several months.


The MLS® Home Price Index composite benchmark price for all residential properties in Metro Vancouver is currently $1,037,300. This represents a 10.9 per cent increase over September 2016 and a 0.7 per cent increase compared to August 2017.


Sales of detached properties in September 2017 reached 852, a 27.9 per cent increase from the sales recorded in September 2016 (666), a decrease of 33 per cent from September 2015 (1,272), and a decrease of 32.9 per cent from September 2014 (1,270). The benchmark price for detached properties is $1,617,300. This represents a 2.9 per cent increase from September 2016 and a 0.1 per cent increase compared to August 2017.


Sales of apartment properties reached 1,451 in September 2017, a 19.1 per cent increase compared from the sales recorded in September 2016 (1,218), a 5.1 per cent decrease from September 2015 (1,529), and a 22.1 per cent increase from September 2014 (1,188). The benchmark price of an apartment property is $635,800. This represents a 21.7 per cent increase from September 2016 and a 1.4 per cent increase compared to August 2017.


Attached property sales in September 2017 totalled 518, a 40.4 per cent increase compared to the sales recorded in September 2016 (369), a 4.8 per cent decrease from September 2015 (544), and an 11.6 per cent increase from September 2014 (464). The benchmark price of an attached home is $786,600. This represents a 14.5 per cent increase from September 2016 and a 1.1 per cent increase compared to August 2017.


*Editor’s Note: Areas covered by the Real Estate Board of Greater Vancouver include: Whistler, Sunshine Coast, Squamish, West Vancouver, North Vancouver, Vancouver, Burnaby, New Westminster, Richmond, Port Moody, Port Coquitlam, Coquitlam, Pitt Meadows, Maple Ridge, and South Delta.

The real estate industry is a key economic driver in British Columbia. In 2016, 39,943 homes changed ownership in the Board’s area, generating $2.5 billion in economic spin-off activity and an estimated 17,600 jobs. The total dollar value of residential sales transacted through the MLS® system in Greater Vancouver totalled $40 billion in 2016.


The Real Estate Board of Greater Vancouver is an association representing more than 13,500 REALTORS® and their companies. The Board provides a variety of member services, including the Multiple Listing Service®. For more information on real estate, statistics, and buying or selling a home, contact a local REALTOR® or visit www.rebgv.org.

Read

Welcome to 2215 Paradise Ave! Fully renovated beautiful modern house on huge 9636 sf lot in premium location in Coquitlam East! Completed like brand new house w/top notch quality, spacious living & dining, open concept custom gourmet's dream kitchen w/ brand new Miele appliances, premium engineered hardwood floor, all new high energy efficient windows, new drywall, new insulation, new electrical wiring, new plumbing, all exterior stone work done w/ Fusion Stone, finished BSMT w/separate studio suite, easy reconfiguration w/ 4th bdrm & rough in 2nd bsmt full bath, large heated & insulated garage w/14ft garage door w/side lift motors, workshop/playroom w/separate electrical panel for handyman/home mechanic, must see to appreciate!


Listing offered by: Re/Max Real Estate Services

Read

Housing affordability in Canada hit the worst level in 27 years in the second quarter of this year, according to a Royal Bank of Canada report.


RBC Economics said in a report Friday that its housing affordability measure for Canada deteriorated for the eighth straight quarter.


The least-affordable place to purchase a home remains the Vancouver area, where affordability worsened after two straight quarters of improvement but remains better than a year ago. Outside of British Columbia and Ontario, affordability remains mostly stable, RBC said.


RBC’s housing affordability measure shows the proportion of median pre-tax household income required to service the costs of owning the average home — factoring in both condos and single-family detached homes — including mortgage payments, property taxes and utilities.


“Clearly, home ownership remains out of reach for many would-be buyers in the area,” RBC Economics said in the report. “The good news is that some relief is on the way. Recent downward pressure on prices is poised to lower ownership costs in the period ahead. The bad news, unfortunately, is that rising interest rates will take some of that relief away.”


The Toronto area was the hardest hit, where RBC says affordability declined the most compared to the previous year and hit the worst level ever measured in the city.


The Ontario government’s actions in April to cool down the housing market, including a foreign buyer’s tax, did not have an immediate impact on provincial housing prices in the second quarter, RBC said.


 The Vancouver area was the least affordable in the latest quarter ended June 30, 2017 at 80.7 per cent, down 2.4 per cent year-on-year. The Toronto area was second-highest at 75.4 per cent, marking an increase of 12.7 per cent. Victoria came in third at 58.6 per cent, with a year-on-year increase of 7.3 per cent. Across Canada, RBC’s housing affordability measure hit 46.7 per cent in the latest quarter, a level not seen since the end of 1990 and an increase of 3.7 per cent from a year earlier.


Many Prairie markets got some relief, with year-on-year decreases in Regina and Saskatoon to 28.7 per cent and 32.1 per cent, respectively, RBC said. Affordability deteriorated marginally in most of Quebec and the Atlantic region. In Quebec City, RBC’s metric improved slightly to 34 per cent. In the Montreal area, it worsened by 0.8 points to 41.5 per cent. In Saint John and Halifax, RBC’s affordability measure worsened to 24.5 per cent and 32.1 per cent, respectively, while it improved slightly to 27.7 in St. John’s.


Affordability in Edmonton worsened slightly year-on-year to hit 30.3 per cent. In Calgary, however, affordability deteriorated by 1.5 per cent year-on-year to 39.2 per cent.


Rising interest rates will further weigh on Canadians’ ability to afford a home, RBC said. After rate hikes in June and September, RBC’s economists expect the Bank of Canada to raise its overnight rate one more time before year-end and three times in 2018 for a total increase of 100 basis points.


RBC Economics estimates that, everything else remaining constant, a 100 basis point increase in mortgage rates would worsen RBC’s national housing affordability measure by roughly 3.5 percentage points. Canada’s most expensive housing markets would be hit harder, RBC adds, noting Vancouver would see an almost 7 per cent increase.


“This would occur at a time when housing affordability is already stretched in some of Canada’s largest markets,” RBC Economics said in the report. “While high sensitivity to a rise in interest rates highlights material vulnerability, the reality is bound to be less threatening as other factors such as income gains will mitigate at least of part of the impact.”


Provided by: The Canadian Press

Read

We are residents of Ontario and were looking to buy some property in Burnaby. As we were new to the BC real estate market we really wanted someone that we could put our faith in and that would look after our best interests.


When we first contacted Hafez we immediately felt that he was very knowledgeable about the local real estate market, history on the area and market conditions.


Hafez gave us a very good understanding of the differences in the two markets and was there step... by step with us throughout the entire buying procedure even though we were thousands of kilometers away during the whole process. He also investigated and analyzed the condo documents extensively for us.


In the end, we felt that Hafez went above and beyond what other agents might have done and would highly endorse Hafez to anyone thinking of buying or selling their property.


Tim M.

Read

HIGHLIGHTS


• 5-year fixed mortgage rates hit three-year high
• Rapid economic growth, but still no sign of inflation
• Bank of Canada tightening, but how quickly?


Mortgage Rate Outlook

Since our second quarter forecast, our projected rise in mortgage rates has occurred and accelerated, as the Bank of Canada—spurred by economic growth that far exceeded its outlook—turned suddenly hawkish. The Bank surprised with a 25-basis point increase in July and then again in September, taking its overnight rate back to 1 per cent, where it was before the precipitous drop in oil prices that shocked the Canadian economy in 2014. After the July interest rate hike, markets widely expected at least one additional rate increase in the fall, and so bond markets and lenders had already priced in the September increase by the time it occurred.


Over the past 12 months, the 5-year bond yield has risen 110 basis points to a three-year high of close to 1.8 per cent, prompting a 60-basis point increase in 5-year discounted mortgage rates to above 3 per cent for the first time since 2014. The 5-year qualifying rate has risen just 20 basis points to 4.84 per cent. The latter is an interesting development, because it is the first increase in the posted rate since stricter qualifying rules for insured mortgages were imposed last fall. Rising mortgage rates may complicate the introduction of further mortgage qualifying restrictions slated for October, this time tightening lending for uninsured mortgages.


We anticipate that the Bank of Canada will hold off on further rate increases this year and assess how higher rates are impacting the economic and inflation outlook. However, in the Bank’s recent communications, it has very clearly left the door open for more aggressive tightening should the current torrid pace of economic growth continue. Our baseline forecast is for the 5-year fixed mortgage rate offered by lenders to average 3.15 over the fourth quarter, eventually rising to 3.44 by the end of 2018. The posted 5-year qualifying rate is forecast to reach 5.14 per cent by the end of next year.


Economic Outlook
The Canadian economy is forecast to post its best year of growth since 2013, propelled by 4 per cent average quarterly growth in the first half of 2017. That accelerated pace of growth has meant that excess capacity in the economy, referred to by economists and central banks as the “output gap,” is rapidly being eliminated. The output gap is important because it is used by the Bank of Canada as a guide to future inflation. An economy operating above its potential, as the Canadian economy is on track to do, should be inflationary. Since monetary policy acts with long and variable lags, quelling expected future inflation would necessitate higher interest rates today. Significantly, all measures of inflation monitored by the Bank of Canada currently sit well below the Bank’s official 2 per cent target and, to date, show very little sign of accelerating. Changes to inflation will be key to future movements in interest rates. We expect the economy will continue to grow above trend in the third and fourth quarters, and will ultimately expand by 3.3 per cent for all of 2017 before slowing in 2018 to 2.3 per cent, as higher interest rates and a soaring loonie start to drag on the economy.


Mortgage Rate Forecast


2017

2018

Term

Q1

Q2

Q3

Q4F

Q1F

Q2F

Q3F

Q4F

1-Year

3.14

3.14

3.14

3.24

3.24

3.24

3.44

3.44

5-Year Qualifying Rate


4.64


4.64


4.79


4.94


4.94


5.04


5.14


5.14

Average 5-Year Mortgage Rate


2.75


2.61


2.94


3.15


3.20


3.34


3.34


3.44

Source: Bank of Canada; BCREA Economics; Rate Spy

Note: Average 5-year discounted rate is the average rate available in the market, offered at a discount from the posted 5-year qualifying rate.


Interest Rate Outlook

Given the rapid expansion in the Canadian economy, it is clear the stimulus introduced to offset falling oil prices is no longer required. However, the policy direction going forward is less clear, given the chronic undershooting of the Bank’s inflation target over the past year.


If sustained economic growth and a closing of the current output gap bring higher inflation, the Bank will likely embark on a more sustained cycle of rate increases to close the wide gap between its current target rate and its estimate of the “neutral” rate at which the economy runs neither too hot nor too cold. The Bank itself estimates that neutral rate in a range of 3 per cent to 3.5 per cent, which means a further 200 to 250 basis points of tightening in the future. However, should inflation remain stubbornly low, the case for rate hikes loses some urgency. Our baseline forecast is for gradual rate increases over the next two years, with the Bank of Canada’s overnight rate ending 2018 at 1.5 per cent.


Provided by: BCREA - “Copyright British Columbia Real Estate Association. Reprinted with permission.” 

Read

Completely renovated 2 story END UNIT at Stonehouse Estates with 3 bedrooms & 3 baths! Brought right into 2017 this 1,500 sqft home has been opened up & has a new kitchen with an 8 ft island, quartz counters, roll out spice & utensil racks, appliance garage. Elec fireplaces in the vaulted living room & family room. French doors to a patio & large fully fenced yard. The master suite has an ensuite with rain head shower & WI closet. Main bath up & floor powder room have been updated too. New high end laminate, porcelain tile, custom doors, crown moldings, tubular steel & glass railings, up/down blinds, lighting & paint throughout. New furnace & central air. Rare side by side double garage. One of the nicest locations in the complex.


Listing offered by: Re/Max Lifestyles Realty

Read

According to statistics[1] released today by The Canadian Real Estate Association (CREA), Association (CREA), national home sales posted a small gain in August 2017.

Highlights:

  • National home sales rose 1.3% from July to August.
  • Actual (not seasonally adjusted) activity stood 9.9% below last August's level.
  • The number of newly listed homes fell a further 3.9% from July to August.
  • The MLS® Home Price Index (HPI) was up 11.2% year-over-year (y-o-y) in August 2017.
  • The national average sale price climbed by 3.6% y-o-y in August.

The number of homes sold via Canadian MLS® Systems edged up by 1.3% in August 2017. The small gain breaks a string of four straight declines, but still leaves activity 13.8% below the record set in March.


There was a roughly even split between the number of local markets where sales posted a monthly increase and those where activity declined. The monthly rebound in Greater Toronto Area (GTA) (14.3% month-over-month) sales fueled the national increase. For Canada net of the GTA, sales activity was flat. While it was the first monthly increase in activity since Ontario's Fair Housing Policy was announced, GTA sales activity remained well down compared to the peak reached in March (-36%) and year-ago levels (-32%).


Actual (not seasonally adjusted) activity was down 9.9% on a y-o-y basis in August 2017. Sales were down from year-ago levels in about 60% of all local markets, led by the GTA and nearby housing markets.


"Experience shows that home buyers watch mortgage rates carefully and that recent interest rate increases will prompt some to make an offer before rates move higher, while moving others to the sidelines," said CREA President Andrew Peck. "All real estate is local, and REALTORS® remain your best source for information about sales and listings where you live or might like to."


"Time will tell whether the monthly rise in August sales activity marks the beginning of a rebound, particularly in the Greater Golden Horseshoe region and other higher-priced urban centres," said Gregory Klump, CREA's Chief Economist. "The picture will become clearer once mortgages that were pre-approved prior to recent interest rate hikes expire."


The number of newly listed homes slid a further 3.9% in August, marking a third consecutive monthly decline. The national result largely reflects a reduction in newly listed homes in the GTA, Hamilton-Burlington, London-St. Thomas and Kitchener-Waterloo, as well as the Fraser Valley.


With sales up and new listings down in August, the national sales-to-new listings ratio rose to 57% compared to 54.1% in July. A national sales-to-new listings ratio of between 40% and 60% is generally consistent with balanced national housing market, with readings below and above this range indicating buyers' and sellers' markets respectively.


That said, the rule of thumb varies according to local market level. Considering the degree and duration to which current market balance in each local market is above or below its long-term average is a more sophisticated way of gauging whether local conditions favour buyers or sellers. (Market balance measures that are within one standard deviation of the long-term average are generally consistent with balanced market conditions).


Based on a comparison of the sales-to-new listings ratio with its long-term average, some 70% of all local markets were in balanced market territory in August 2017, up from 63% the previous month. A decline in new listings has firmed market balance in a number of Greater Golden Horseshoe housing markets where it had recently begun tilting toward buyers' market territory.


The number of months of inventory is another important measure of the balance between housing supply and demand. It represents how long it would take to completely liquidate current inventories at the current rate of sales activity.


There were 5 months of inventory on a national basis at the end of August 2017, down from 5.1 in July and slightly below the long-term average of 5.2 months.

Chart A

Chart A

At 2.3 months of inventory, the Greater Golden Horseshoe region is up sharply from the all-time low of 0.8 months reached in February and March just before the Ontario government announced housing policy changes in April. However, it remains well below the long-term average of 3.1 months. (Chart A)


The Aggregate Composite MLS® HPI rose by 11.2% y-o-y in August 2017, representing a further deceleration in y-o-y gains since April. The deceleration in price gains largely reflects softening price trends in Greater Golden Horseshoe housing markets tracked by the index. (Chart B)


Chart B

Chart B

Price gains diminished in all benchmark categories, led by two-storey single family homes. Apartment units posted the largest y-o-y gains in August (+19.5%), followed by townhouse/row units (+14.4%), two-storey single family homes (+8.3%), and one-storey single family homes (+8.1%).


While benchmark home prices were up from year-ago levels in 12 of 13 housing markets tracked by the MLS® HPI, price trends continued to vary widely by region.


After having dipped in the second half of last year, benchmark home prices in the Lower Mainland of British Columbia have recovered and are now at new highs (Greater Vancouver: +9.4% y-o-y; Fraser Valley: +14.8% y-o-y).


Benchmark home price increases have slowed to about 16% on a y-o-y basis in Victoria, and are still running at about 20% elsewhere on Vancouver Island.


Price gains slowed further on a y-o-y basis in Greater Toronto, Oakville-Milton and Guelph; however, prices in those markets remain well above year-ago levels (Greater Toronto: +14.3% y-o-y; Oakville-Milton: +11.4% y-o-y; Guelph: +19.5% y-o-y).


Calgary benchmark price growth remained in positive territory on a y-o-y basis in August (+0.8%). While Regina home prices popped back above year-ago levels (+5.6% y-o-y), Saskatoon home prices remain down (-0.3% y-o-y). That said, prices of late have been trending higher in both Regina and Saskatoon and if recent trends hold, Saskatoon prices will also turn positive on a y-o-y basis before year-end.


Benchmark home price growth accelerated in Ottawa (+5.9% y-o-y overall, led by a 7% increase in one-storey single family home prices) and was up in Greater Montreal (+4.6% y-o-y overall, led by a 7.1% increase in prices for townhouse/row units). Prices were up 5.1% overall in Greater Moncton, led by a 7.9% y-o-y gain in townhouse/row prices. (Table 1)


The MLS® Home Price Index (MLS® HPI) provides the best way of gauging price trends because average price trends are prone to being strongly distorted by changes in the mix of sales activity from one month to the next.


The actual (not seasonally adjusted) national average price for homes sold in August 2017 was $472,247, up 3.6% from where it stood one year earlier. The national average price is heavily skewed by sales in Greater Vancouver and Greater Toronto, two of Canada's most active and expensive markets. Excluding these two markets from calculations trims almost $100,000 from the national average price ($373,859). 


The information contained in this news release combines both major market and national sales information from MLS® Systems from the previous month.

CREA cautions that average price information can be useful in establishing trends over time, but does not indicate actual prices in centres comprised of widely divergent neighbourhoods or account for price differential between geographic areas. Statistical information contained in this report includes all housing types.

MLS® Systems are co-operative marketing systems used only by Canada’s real estate Boards to ensure maximum exposure of properties listed for sale.

The Canadian Real Estate Association (CREA) is one of Canada’s largest single-industry trade associations, representing more than 115,000 REALTORS® working through some 90 real estate Boards and Associations.

Read

The British Columbia Real Estate Association (BCREA) reports that a total of 9,162 residential unit sales were recorded by the Multiple Listing Service® (MLS®) in August, an increase of 2.4 per cent from the same period last year. Total sales dollar volume was $6.2 billion, up 22 per cent from August 2016. The average MLS® residential price in the province was $678,186, a 19.1 per cent increase from August 2016.


“BC home sales in August remained unchanged from July, on a seasonally adjusted basis,” said Cameron Muir, BCREA Chief Economist. “Strong economic conditions are underpinning demand. However, rising home prices combined with upward pressure on mortgage interest rates is expected to temper demand over the balance of the year.”

Year-to-date, BC residential sales dollar volume was down 15.9 per cent to $51.8 billion, when compared with the same period in 2016. Residential unit sales declined 15.0 per cent to 73,267 units, while the average MLS® residential price was down 1.1 per cent to $706,839.


August 2017 Year-to-Date BC Residential Multiple Listing Service® Data by Board


Board

Dollar Volume (000s)

Unit Sales

Average Price


2017

($)

2016

($)

% change

2017

2016

%

change

2017

($)

2016

($)

% change

BC Northern

825,228

770,706

7.1

2,936

2,925

0.4

281,072

263,489

6.7

Chilliwack

1,303,747

1,310,868

-0.5

2,833

3,325

-14.8

460,200

394,246

16.7

Fraser Valley

10,623,789

12,747,816

-16.7

15,230

18,353

-17

697,557

694,590

0.4


Greater Vancouver


26,458,791


33,884,455


-21.9


25,750


32,294


-20.3


1,027,526


1,049,249


-2.1

Kamloops

849,285

780,258

8.8

2,340

2,291

2.1

362,942

340,575

6.6

Kootenay

701,653

554,960

26.4

2,272

1,983

14.6

308,826

279,859

10.4


Okanagan Mainline


3,208,514


3,381,822


-5.1


6,513


7,349


-11.4


492,632


460,174


7.1

Powell River

84,139

86,413

-2.6

272

303

-10.2

309,333

285,193

8.5

South Okanagan

689,090

648,591

6.2

1,752

1,789

-2.1

393,316

362,544

8.5

Northern Lights

68,222

40,542

68.3

269

163

65

253,615

248,725

2

Vancouver Island

2,981,920

2,983,738

-0.1

6,934

7,828

-11.4

430,043

381,162

12.8

Victoria

3,993,567

4,393,742

-9.1

6,166

7,604

-18.9

647,676

577,820

12.1

Provincial Totals*

51,787,944

61,583,913

-15.9

73,267

86,207

-15

706,839

714,373

-1.1


* Numbers may not add due to rounding 

August 2017 Residential Average Price, Active Listings

and Sales-to-Active-Listings Data by Board 


Board

Average Price

Active Listings

Sales-to-Active-Listings

August 2017 Residential Average Price

($)

August 2016 Residential Average Price

($)

%

change

August 2017 Residential Active Listings

(Units)

August 2016 Residential Active Listings

(Units)


% change

August 2017 Residential Sales to Active

Listings (%)

August 2016 Residential Sales to Active

Listings (%)

BC Northern

288,175

264,902

8.8

2,794

2,936

-4.8

13.7

14.9

Chilliwack

477,515

396,958

20.3

894

938

-4.7

39.3

40.5

Fraser Valley

689,700

616,286

11.9

4,480

4,800

-6.7

40.7

33.5

Greater Vancouver

982,454

833,065

17.9

9,470

9,198

3

32.7

27.8

Kamloops

360,288

352,588

2.2

1,278

1,708

-25.2

25.9

21.2

Kootenay

300,824

299,602

0.4

2,302

2,679

-14.1

14.8

12.3

Okanagan Mainline

489,130

464,982

5.2

3,365

3,374

-0.3

26.2

30.2

Powell River

318,950

319,784

-0.3

92

115

-20

32.6

40

South Okanagan

390,611

346,338

12.8

1,106

1,126

-1.8

20.3

22.3

Northern Lights

262,685

242,782

8.2

491

440

11.6

7.9

6.4

Vancouver Island

438,212

384,590

13.9

2,730

2,996

-8.9

35.6

36.3

Victoria

651,023

570,196

14.2

1,398

1,440

-2.9

49.5

58.2

Provincial Totals*

678,186

569,281

19.1

30,400

31,750

-4.3

30.1

28.2


*Numbers may not add due to rounding

August 2017 BC Residential Multiple Listing Service® Data by Board 


Board

Dollar Volume (000s)

Units

August 2017 Residential Sales ($)

August 2016 Residential Sales ($)


% change

August 2017 Residential Sales

(Units)

August 2016 Residential Sales

(Units)


% change

BC Northern

110,371

116,027

-4.9

383

438

-12.6

Chilliwack

167,608

150,844

11.1

351

380

-7.6

Fraser Valley

1,256,634

992,220

26.6

1,822

1,610

13.2

Greater Vancouver

3,042,660

2,127,648

43

3,097

2,554

21.3

Kamloops

119,255

127,637

-6.6

331

362

-8.6

Kootenay

102,280

98,869

3.5

340

330

3

Okanagan Mainline

431,413

474,281

-9

882

1,020

-13.5

Powell River

9,569

14,710

-35

30

46

-34.8

South Okanagan

87,497

86,931

0.7

224

251

-10.8

Northern Lights

10,245

6,798

50.7

39

28

39.3

Vancouver Island

425,504

418,434

1.7

971

1,088

-10.8

Victoria

450,508

477,824

-5.7

692

838

-17.4

Provincial Totals*

6,213,543

5,092,222

22

9,162

8,945

2.4


*Numbers may not add due to rounding


**NOTE: The Northern Lights Real Estate Board (NLREB) became part of the South Okanagan Real Estate Board (SOREB) on May 1, 2011.


BCREA is the professional association for about 22,000 REALTORS® in BC, focusing on provincial issues that impact real estate. Working with the province’s 11 real estate boards, BCREA provides continuing professional education, advocacy, economic research and standard forms to help REALTORS® provide value for their clients.

To demonstrate the profession’s commitment to improving Quality of Life in BC communities, BCREA supports policies that help ensure economic vitality, provide housing opportunities, preserve the environment, protect property owners and build better communities with good schools and safe neighbourhoods.

For detailed statistical information, contact your local real estate board. MLS® is a cooperative marketing system used only by Canada’s real estate boards to ensure maximum exposure of properties listed for sale.

Read

Calling all Nature Lovers

Huge 1/4 + Acre Lot

Open: Sep 16 & 17 from 2 to 4

Priced at $1,598,800


Enjoy a StayCation 365 days a year! Amazing 14000sqft forested lot in Coquitlam West. Enter over Stoney Creek using your own private bridge! What awaits you is a 3lvl/3441sqft/4bed/4bath/19yr young custom-built home. Freshly painted, brand new carpets & updates throughout. Features: formal dining rm, huge kitchen w/island, eating area & spacious vaulted-ceiling living rm, all completely wrapped in massive windows offering tons of light & access to a wrap-around patio. Up: master w/walk-in & spa inspired ensuite, 2lrg rms, 4pc bath & flex space. Down: billiards sized rec rm & potential for 1bed suite. Bonus: over-height garage & tons of storage. Central to everything but far enough to call a retreat. OPEN Sat/Sun Sept 16/17 from 2 to 4.


Read

The Bank of Canada is raising its target for the overnight rate to 1 per cent. The Bank Rate is correspondingly 1 1/4 per cent and the deposit rate is 3/4 per cent.


Recent economic data have been stronger than expected, supporting the Bank’s view that growth in Canada is becoming more broadly-based and self-sustaining. Consumer spending remains robust, underpinned by continued solid employment and income growth. There has also been more widespread strength in business investment and in exports.


Meanwhile, the housing sector appears to be cooling in some markets in response to recent changes in tax and housing finance policies. The Bank continues to expect a moderation in the pace of economic growth in the second half of 2017, for the reasons described in the July Monetary Policy Report (MPR), but the level of GDP is now higher than the Bank had expected.


The global economic expansion is becoming more synchronous, as anticipated in July, with stronger-than-expected indicators of growth, including higher industrial commodity prices. However, significant geopolitical risks and uncertainties around international trade and fiscal policies remain, leading to a weaker US dollar against many major currencies. In this context, the Canadian dollar has appreciated, also reflecting the relative strength of Canada’s economy.


While inflation remains below the 2 per cent target, it has evolved largely as expected in July. There has been a slight increase in both total CPI and the Bank’s core measures of inflation, consistent with the dissipating negative impact of temporary price shocks and the absorption of economic slack. Nonetheless, there remains some excess capacity in Canada’s labour market, and wage and price pressures are still more subdued than historical relationships would suggest, as observed in some other advanced economies.


Given the stronger-than-expected economic performance, Governing Council judges that today’s removal of some of the considerable monetary policy stimulus in place is warranted. Future monetary policy decisions are not predetermined and will be guided by incoming economic data and financial market developments as they inform the outlook for inflation. Particular focus will be given to the evolution of the economy’s potential, and to labour market conditions. Furthermore, given elevated household indebtedness, close attention will be paid to the sensitivity of the economy to higher interest rates.


Information note:
The next scheduled date for announcing the overnight rate target is October 25, 2017. The next full update of the Bank’s outlook for the economy and inflation, including risks to the projection, will be published in the MPR at the same time.


Provided by the: Bank of Canada

Read
Reciprocity Logo The data relating to real estate on this website comes in part from the MLS® Reciprocity program of either the Greater Vancouver REALTORS® (GVR), the Fraser Valley Real Estate Board (FVREB) or the Chilliwack and District Real Estate Board (CADREB). Real estate listings held by participating real estate firms are marked with the MLS® logo and detailed information about the listing includes the name of the listing agent. This representation is based in whole or part on data generated by either the GVR, the FVREB or the CADREB which assumes no responsibility for its accuracy. The materials contained on this page may not be reproduced without the express written consent of either the GVR, the FVREB or the CADREB.