RSS

According to statistics released today by The Canadian Real Estate Association (CREA), national home sales were up on a month-over-month basis in October 2016.


Highlights:

  • National home sales rose 2.4% from September to October.
  • Actual (not seasonally adjusted) activity was up 2.0% year-over-year (y-o-y) in October 2016.
  • The number of newly listed homes edged up 1.7% from September to October.
  • The MLS® Home Price Index (HPI) in October was up 14.6% y-o-y.
  • The national average sale price climbed 5.9% y-o-y.

The number of homes trading hands via Canadian MLS® Systems rose 2.4 percent month-over-month in October 2016.


Activity was up on a month-over-month basis about 60 percent of all local markets, led by the Fraser Valley, Calgary, Edmonton, Hamilton-Burlington and Montreal.


“The expanded stress-test for home buyers who need mortgage default insurance took effect in the middle of October,” said CREA President Cliff Iverson. “More time will need to pass before its effect on housing markets can be gauged. The extent to which they will push first-time home buyers to the sidelines may vary among housing markets. All real estate is local, and REALTORS® remain your best source for information about sales and listings where you live or might like to in the future.”


“First-time home buyers looking to get into the market before having to face tougher mortgage eligibility criteria had only two weeks to do so following the Finance Minister’s announcement of tighter mortgage regulations in early October,” said Gregory Klump, CREA’s Chief Economist. “Early evidence suggests that the influence of tighter mortgage regulations on sales activity has been mixed. The federal government will no doubt want to monitor the effect of new mortgage regulations on the many varied housing markets across Canada and on the economy, particularly given the recent rise in uncertainty about economic growth prospects following the U.S. presidential election.”


Actual (not seasonally adjusted) sales activity rose 2 percent y-o-y in October 2016 to set a record for the month, edging out the previous record set back in October 2009 by just 0.8 percent.


Transactions were up from year-ago levels in about 60 percent of all Canadian markets, with activity gains in the Greater Toronto Area (GTA) and environs offset by y-o-y declines in B.C.’s Lower Mainland.


The number of newly listed homes climbed 1.7 percent in October 2016 compared to September. Led by a marked increase in the GTA, new listings were up from the previous month in about 60 percent of all local markets.


With sales having risen by slightly more than new listings in October, the national sales-to-new listings ratio edged higher to 62.9 percent compared to 62.4 percent in September.


A sales-to-new listings ratio between 40 and 60 percent is generally consistent with balanced housing market conditions, with readings below and above this range indicating buyers’ and sellers’ markets respectively.


The ratio was above 60 percent in half of all local housing markets in October, the vast majority of which continue to be located in British Columbia, in and around the Greater Toronto Area and across Southwestern Ontario. The ratio has moved out of sellers’ market territory and into the mid-50 percent range in Greater Vancouver.


The number of months of inventory is another important measure of the balance between housing supply and demand. It represents the number of months it would take to completely liquidate current inventories at the current rate of sales activity.


There were 4.5 months of inventory on a national basis at the end of October 2016 – the lowest level in almost 7 years.


The tight balance between housing supply and demand in Ontario’s Greater Golden Horseshoe region is without precedent (including the GTA, Hamilton-Burlington, Oakville-Milton, Guelph, Kitchener-Waterloo, Cambridge, Brantford, the Niagara Region, Barrie and nearby cottage country). In October, the number of months of inventory ranged between one and two months in many of these housing markets, and has slipped to below one month in Mississauga, the Durham Region, Orangeville, Cambridge and Guelph.


The Aggregate Composite MLS® HPI rose by 14.6 percent y-o-y in October 2016, up from 14.4 percent in September.


On a y-o-y basis, price growth accelerated for two-storey single family homes and apartment units while slowing for townhouse/row units.


Benchmark prices for two-storey single family homes and townhouse/row units posted the biggest y-o-y gains in October 2016 (16.7 percent and 16.0 percent respectively). Price increases were not far behind for one-storey single family homes (14.0 percent) and apartment units (11.4 percent).


While prices in 9 of the 11 markets tracked by the MLS® HPI posted y-o-y gains in October, increases continue to vary widely among housing markets.


Greater Vancouver (+24. 8 percent) and the Fraser Valley (+32.5 percent) posted the largest y-o-y gains, although single family home prices in both of these markets are now off peak.


Double-digit y-o-y percentage price gains were also registered in Greater Toronto (+19.7 percent), Victoria (+20.1 percent) and Vancouver Island (+15.8 percent).


By contrast, prices were down 4.1 percent y-o-y in Calgary. Although home prices there have held mostly steady since May, they have been below year-ago levels since August 2015 and are down 5.1 percent from the peak reached in January 2015.


Home prices also edged lower by 1.3 percent y-o-y in Saskatoon. Home prices in Saskatoon have also held below year-ago levels since August 2015.


Meanwhile, home prices posted y-o-y gains in Regina (+4.5 percent), Ottawa (+3.0 percent), Greater Moncton (+2.8 percent) and Greater Montreal (+2.6 percent).


The MLS® Home Price Index (MLS® HPI) provides the best way of gauging price trends because average price trends are prone to being strongly distorted by changes in the mix of sales activity from one month to the next.

The actual (not seasonally adjusted) national average price for homes sold in October 2016 was up 5.9 percent y-o-y to $481,994.


The national average price continues to be pulled upward by sales activity in Greater Vancouver and Greater Toronto, which remain two of Canada’s tightest, most active and expensive housing markets.


That said, Greater Vancouver’s share of national sales activity has diminished considerably of late, resulting in it having less upward influence on the national average price. Even so, the average price is reduced by more than $120,000 to $361,012 if Greater Vancouver and Greater Toronto sales are excluded from calculations.

 

Read

The British Columbia Real Estate Association (BCREA) reports that 7,272 residential unit sales were recorded by the Multiple Listing Service® (MLS®) in October, down 16.7 per cent from the same month last year. Total sales dollar volume was $4.4 billion in October, down 24.2 per cent compared to the previous year. The average MLS® residential price in the province was $606,787, a decline of 9.1 per cent compared to the same month last year.

“Housing demand remained mixed across the province in October,” said Cameron Muir, BCREA Chief Economist. “Home sales across the Lower Mainland were down from the elevated levels of one year ago, but stabilized on a month to month basis. In contrast, home sales on Vancouver Island and in the interior of the province continue to post strong year-over-year gains.”

“The decline in the average residential price reflects a smaller proportion of transactions in the province originating in Vancouver,” added Muir. Home sales through the Real Estate Board of Greater Vancouver fell to 31.4 percent of BC transactions last month, compared to 42.6 per cent a year ago.

Year-to-date, BC residential sales dollar volume increased 27.4 per cent to $70.4 billion, when compared with the same period in 2015. Residential unit sales climbed by 15 per cent to 101,069 units, while the average MLS® residential price was up 10.8 per cent to $696,992.

-

Read

Breath Taking Views

Priced at $574,800


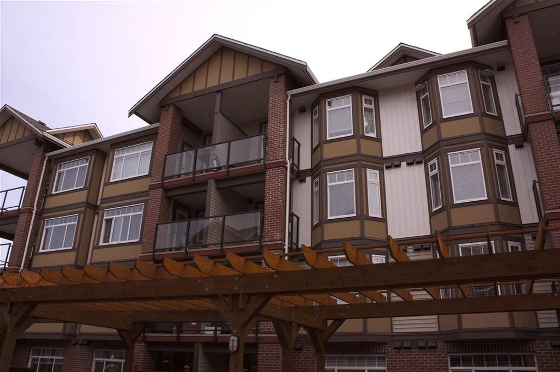
Gorgeous home offering breath-taking views of Burrard Inlet & privacy from green space. This exceptionally bright 2bed/2bath/1039sqft home features a spacious layout, fireplace, floor to ceiling windows, a large balcony, granite counters, stainless apps & so much more. The large master has walk-in & ensuite w/dual sinks, soaker & shower. Bonus: custom closet organizers & cabinets add lots of in-suite storage & separate locker. Altaire, Polygon built, offers balance of 2-5-10 warranty & fully equipped exercise room. Close to: transit, shopping, indoor/outdoor rec & a host of perks available only to UniverCity residences. Do not miss your chance to enjoy living in this great lifestyle neighborhood!  


Read

The trend measure of housing starts in Canada was 199,920 units in October compared to 199,262 in September, according to Canada Mortgage and Housing Corporation (CMHC). The trend is a six-month moving average of the monthly seasonally adjusted annual rates (SAAR) of housing starts.


“In October, housing starts remained stable, as the trend remained essentially unchanged from September,” said Bob Dugan, CMHC Chief Economist. “While apartment starts are on a downward trend in British Columbia after reaching an all-time high at the beginning of the year, increased construction of single, semi-detached and row units in the rest of the country have helped offset the decline.”


CMHC uses the trend measure as a complement to the monthly SAAR of housing starts to account for considerable swings in monthly estimates and obtain a more complete picture of the state of Canada’s housing market. In some situations analyzing only SAAR data can be misleading, as they are largely driven by the multi-unit segment of the market which can vary significantly from one month to the next.


The standalone monthly SAAR for all areas in Canada was 192,928 units in October, down from 219,363 units in September. The SAAR of urban starts decreased by 12.1 per cent in October to 176,131 units. Multiple urban starts decreased by 15.3 per cent to 115,402 units in October and single-detached urban starts decreased by 5.4 per cent to 60,729 units.


In October, the seasonally adjusted annual rate of urban starts decreased in British Columbia, Quebec, the Prairies, and in Atlantic Canada, but increased in Ontario.


Rural starts were estimated at a seasonally adjusted annual rate of 16,797 units.


Preliminary Housing Starts data is also available in English and French at the following link: Preliminary Housing Starts Tables


As Canada’s authority on housing, CMHC contributes to the stability of the housing market and financial system, provides support for Canadians in housing need, and offers objective housing research and information to Canadian governments, consumers and the housing industry.

Read

Canadian housing starts slowed in October as the once-hot British Columbia market braked sharply, while separate data on Tuesday showed the value of building permits slipped in September, suggesting the country's long property boom is cooling.


Groundbreaking on new homes fell to 192,928 units in October, roughly in line with expectations, from a revised seasonally adjusted annual rate of 219,363 units in September, the Canada Mortgage and Housing Corp said.


The slowdown in new construction was sharpest in British Columbia, where starts dropped 44.9 percent. Vancouver, Canada's most expensive housing market, has come off the boil since the August introduction of a tax on foreign buyers in that city.


Housing starts in Ontario, by contrast, rose 20.0 percent in October, suggesting Canada's largest city, Toronto, remains red-hot, the report from the federal housing agency showed.


A long housing boom in Canada sparked fears of a real estate bubble, and the government has moved multiple times to tighten mortgage and tax rules to prevent borrowers from taking on too much debt to get into the market.


"Residential construction activity remains a highly regional story in Canada. The new development in October was the falloff in Vancouver, which could be the first sign that builders are responding to much softer demand in that region," BMO Capital Markets senior economist Robert Kavcic said in a research note.


The addition of a 15 percent surcharge on foreign buyers in Vancouver has cooled the most expensive segment of that market, but Toronto still sees bidding wars for many homes, particularly detached houses. The market in the rest of the country has mostly cooled.


The slowdown in housing starts was more pronounced in the multiples segment - typically condos and apartments - than in detached housing, the report showed. Multiple urban starts fell 15.3 percent, while single-detached urban starts notched a milder 5.4 percent decline.


A separate report showed the value of Canadian building permits fell 7 percent in September from August, the biggest drop in eight months, though residential permits were up in the month. Analysts had expected an overall decrease of 5.6 percent.


The decline was attributed to lower construction intentions for non-residential buildings, especially in retail complexes and office buildings.


The total value of residential building permits rose 2.6 percent in September on construction intentions for multi-family dwellings. The non-residential sector fell 22.3 percent, led by a drop in the commercial component.


Andrea Hopkins

Read

After some very disturbing news from British Columbia this summer, where a Globe and Mail investigation discovered that our major banks were favouring foreign buyers by turning a blind eye to a prudent approval process when granting them uninsured mortgages, one has to wonder about the future of housing in this country. Have these deplorable bank practices, since rescinded, fearing the public outcry, been condoned and encouraged by our government, which previously voiced concern about foreign ownership? How else could Ottawa’s (only) recently introduced measures in closing loopholes related to capital gains taxes and mortgage qualifying criteria, be explained? Why so late and only after such reporting?


The mayors of major Canadian cities recently urged federal and provincial governments to address problems of social housing and supply of affordable rental housing, in general. Vancouver Mayor Gregor Robertson took the opportunity to voice his own thoughts on the B.C. foreign buyers’ situation by saying that the province’s 15-per-cent tax on foreign buyers was too little, too late – the days when middle-class Canadians could buy a home in Vancouver or Toronto have probably passed. Not surprising, given that median family income in those cities is about $76,000, but due to enormously inflated prices, it takes well into six figures to afford the carrying cost of an average home in those cities.


Speaking of the B.C. tax on foreign buyers, alarm bells were sounding the threat of a crash. Year over year, Vancouver housing sales were down 39 per cent in October (they were down 15 per cent even before the tax’s introduction) and prices were down 7.5 per cent as of August. But whatever slowdown Vancouver experienced, Toronto and a few other cities have been picking up the slack.


Notwithstanding surcharges and tightening mortgage-qualification measures, it’s quite evident that Ottawa has been complacent in allowing foreign buyers to buy up the roofs over our heads. Indeed, with little else to sell, our economy has depended on it. A recent study suggests that land-transfer taxes will become the main source of income in British Columbia this year. Recent openings of visa centres across China and other countries suggest that we are set to encourage the arrival of even more foreign buyers, who will drive prices higher still.


A sombre thought that comes to mind is what may happen if this comes to make housing completely unaffordable for Canadian citizens. As I’ve suggested on my blog, many of us would likely be forced to become renters.


There are now more millionaires in China than in the United States. Facing uncertain political and economic circumstances at home, many of them are desperate to move their money abroad, and Canada is a popular destination. The National Bank of Canada estimates that Chinese buyers were responsible for about one-third of Vancouver sales in 2015. Many such purchases are made through the children of wealthy Chinese, who are sent to study here and later qualify for permanent resident status, acquire jobs and the right to sponsor their parents.


In the long run, a 15-per-cent tax on foreign buying will not serve as a deterrent. We are at the crossroads of a major global demographic shift in which our aging population is being replenished and enhanced by newcomers, mostly from Asian countries. Canada offers an exceptional opportunity because of its large size and relatively small population. And while it is natural and prudent to enhance our population with qualified immigrants (Chinese included), it is highly unfair to lean on new arrivals who, as a class, arrive with such superior finances. Experience shows that such individuals do not contribute to the growth of our economy the way traditionally selected immigrants do.


The time has come for the federal government to make housing policies its top priority.


Leasing out available government plots to developers would enable the construction of less expensive mid-rises to address social housing and affordability issues.


As for foreign buyers, a 15-per-cent surcharge is simply not enough, with the dollar trading at a discount. In order to dampen demand and bring the housing prices down to the levels Canadians can afford, a surcharge of 50 per cent or more would be appropriate.


If our badly needed housing correction finally does come to pass, we should prohibit foreign buying altogether, as opposition leaders have been calling for in New Zealand. Otherwise, foreign buyers will just be back to gobble up more Canadian housing after its depreciation.


Dan Barnabic 

The Globe & Mail

Read

Reduced home sale and listing activity are changing market dynamics in communities across Metro Vancouver*.


Residential property sales in the region totalled 2,233 in October 2016, a 38.8 per cent decrease from the 3,646 sales recorded in October 2015 and a 0.9 per cent decrease compared to September 2016 when 2,253 homes sold.


Last month’s sales were 15 per cent below the 10-year October sales average.


“Changing market conditions compounded by a series of government interventions this year have put home buyers and sellers in a holding pattern,” Dan Morrison, Real Estate Board of Greater Vancouver (REBGV) president said. “Potential buyers and sellers are taking a wait-andsee approach to try and better understand what these changes mean for them.”


New listings for detached, attached and apartment properties in Metro Vancouver totalled 3,981 in October 2016. This represents a decrease of 3.5 per cent compared to the 4,126 units listed in October 2015 and a 17 per cent decrease compared to September 2016 when 4,799 properties were listed.


Last month’s new listing count was 9.5 per cent below the region’s 10-year new listing average for the month.


The total number of properties currently listed for sale on the MLS® system in Metro Vancouver is 9,143, a 4.5 per cent decrease compared to October 2015 (9,569) and a 2.3 per cent decrease compared to September 2016 (9,354).


The sales-to-active listings ratio for October 2016 is 24.4 per cent. Generally, analysts say that downward pressure on home prices occurs when the ratio dips below the 12 per cent mark for a sustained period, while home prices often experience upward pressure when it surpasses 20 per cent over several months.


“While sales are down across the different property types, it’s the detached market that’s seen the largest reduction in home buyer demand in recent months,” Morrison said. “It’s important to work with your local REALTOR® to help you navigate today’s changing trends.”


The MLS® Home Price Index composite benchmark price for all residential properties in Metro Vancouver is currently $919,300. This represents a 24.8 per cent increase compared to October 2015 and a 0.8 per cent decline compared to September 2016.


Sales of detached properties in October 2016 reached 652, a decrease of 54.6 per cent from the 1,437 detached sales recorded in October 2015. The benchmark price for detached properties is $1,545,800. This represents a 28.9 per cent increase compared to October 2015 and a 1.4 per cent decrease compared to September 2016.


Sales of apartment properties reached 1,178 in October 2016, a decrease of 23.7 per cent compared to the 1,543 sales in October 2015.The benchmark price of an apartment property is $512,300. This represents a 20.5 per cent increase compared to October 2015 and a 0.3 per cent increase compared to September 2016.


Attached property sales in October 2016 totalled 403, a decrease of 39.5 per cent compared to the 666 sales in October 2015. The benchmark price of an attached unit is $669,200. This represents a 25.7 per cent increase compared to October 2015 and a 1.1 per cent decrease compared to September 2016.

Read

Maclean’s Magazine has released its annual list of Canadian university rankings, and Simon Fraser University has topped the list for 2016 in the comprehensive category.


The post-secondary institution tops the list for a number of reasons, including the development of UniverCity, a model sustainable community on the Burnaby Mountain campus.


The Arthur Erickson-designed concrete buildings also got a nod from the magazine, despite them having “fallen into disrepair,” as well as the gorgeous views from the top of the mountain.

See also

Extensive co-op offerings, excellent grants programs, and consistently high rankings internationally cinched the deal for SFU’s top ranking.


“SFU has become internationally recognized for the quality of its educational programs and research, and we’re committed to building on these strengths as we continue to engage the world,” president Andrew Petter told the magazine.


There are some pretty cool course offerings, too: The Science of Brewing breaks down plant biology, chemistry, fermentation technology, and other elements involved in brewing beer.


In a separate best medical and doctoral universities ranking by Maclean’s, the University of British Columbia ranked third in Canada, behind McGill University and the University of Toronto but ahead of Queen’s University.

Top 15 universities in Canada, according to Maclean’s:

  1. Simon Fraser University – Burnaby, BC
  2. University of Waterloo – Waterloo, Ontario
  3. University of Victoria – Victoria, BC
  4. University of Guelph – Guelph, Ontario
  5. Carleton University – Ottawa, Ontario
  6. University of New Brunswick – Fredericton and St. John, New Brunswick
  7. Memorial University of Newfoundland – St. John’s, Newfoundland
  8. York University – Toronto, Ontario
  9. Wilfred Laurier University – Waterloo, Ontario
  10. Concordia University – Montreal, Quebec
  11. Ryerson University – Toronto, Ontario
  12. Université du Québec à Montréal – Montreal, Quebec
  13. University of Regina – Regina, Saskatchewan
  14. University of Windsor – Windsor, Ontario
  15. Brock University – St. Catherines, Ontario
Read

The renewal of the Bank of Canada’s framework for inflation targeting will help Canadian businesses and consumers by providing certainty around their financial plans, Governor Stephen S. Poloz said today.


In a speech to the Business Council of British Columbia, Governor Poloz said the Bank’s inflation-targeting agreement with the federal government, which has been in place for 25 years and which was renewed last week, has helped Canadians spend and invest with more confidence and improved their standard of living.


“Twenty-five is the silver anniversary, but inflation targeting has truly been golden,” Governor Poloz said. “As an approach to monetary policy, inflation targeting has proven its worth repeatedly, both in good economic times as well as turbulent ones.”


Governor Poloz recalled the high and variable inflation of the 1970s and 1980s that led to Canada adopting inflation targets in 1991. That inflation took a tremendous toll on the economy, Poloz said, with the uncertainty making it more difficult for businesses to plan and rising prices eroding the purchasing power of Canadians.


The certainty provided by the policy framework has led to stronger economic performance in many dimensions, the Governor noted. Because the government explicitly agrees with the Bank’s goal of low, stable and predictable inflation, the framework is that much more credible and effective, he said.


In its extensive research leading up to the renewal, the Bank looked at a number of issues, including the potential benefits of a higher inflation target, given the experience of the global financial crisis and its aftermath. It concluded that there would be more costs than benefits to raising the target. In addition, the Bank looked at ways of incorporating financial stability risk into the conduct of monetary policy. It concluded that macroprudential policies are best for addressing financial stability concerns, leaving monetary policy to focus primarily on the inflation target. The inflation-targeting agreement with the government means that all economic policies—including monetary, fiscal and macroprudential—can work together in a complementary fashion, said Governor Poloz.


“The renewal of the inflation-targeting agreement sets us up to extend this track record of success for another five years,” the Governor said. “We will continue to observe and learn, ask questions, and make sure our monetary policy is truly doing its best until the next renewal in 2021.”

Read

Federal, provincial and territorial ministers responsible for housing met today to advance the development of a National Housing Strategy for Canada that will build on a strong housing foundation.


Continuing the progress achieved at their June meeting in Victoria, ministers discussed a shared vision for housing in Canada:

Canadians have housing that meets their needs and they can afford. Housing is a cornerstone of sustainable, healthy and inclusive communities and a strong Canadian economy where we can prosper and thrive.

The Ministers discussed their shared long-term aspirations to improve housing affordability and reduce homelessness across Canada. They also discussed more specific outcomes of a National Housing Strategy that would improve housing conditions and affordability for the most vulnerable, including those with distinct needs, Indigenous peoples and those in Canada's three territories. The proposed outcomes would also contribute to economic growth, environmental sustainability, and increased social and economic participation of low income households.


The outcomes of a National Housing Strategy and the details of a federal, provincial, and territorial partnership will be established through a multi-lateral framework to be developed in 2017.


Federal, provincial and territorial housing ministers agreed to work together in a way that recognizes provinces and territories as primary partners in the development and delivery of a National Housing Strategy and recognizes the importance of collaboration in achieving the best possible outcomes.


Consultations with Canadians, including National Indigenous Organizations, municipalities, housing experts and national stakeholders, have yielded significant feedback on a wide range of housing themes.


The results of what was heard will be released on National Housing Day, November 22, 2016. A National Housing Strategy framework will be made public in 2017. 

Read

Greenbelt Facing

Excellent Central Location

Priced at $338,800


Bright, spacious & a unique plan await you in this Greenbelt 2bed/2bath/1115sqft corner unit-home; tastefully renovated throughout, you won't be disappointed. Located in popular Crescent on the Reeve Creek offering easy Hwy access & walking distance to parks, schools, recreation & tons of amenities. Features: welcoming entrance, fully reno'ed main bath, laminate floors & new carpeting throughout, newer SS apps, full size W/D, updated kitchen with loads of cupboard & counter space, gorgeous rock faced gas F/P & more. The large master has room for king size bed & extra storage plus a walkin & 4 piece ensuite. Benefit from a well sized second bed w/plenty of closet space. Includes parking & storage. Act now.


Read

Canada Mortgage and Housing Corporation (CMHC) is finding strong evidence of problematic conditions for Canada overall. Home prices have risen ahead of economic fundamentals such as personal disposable income and population growth, resulting in overvaluation in many Canadian housing markets. However, the combination of overvaluation and overbuilding should help slow the growth in resales and house prices and lead to a moderation in the pace of housing starts.


This analysis is the result of combined insight from two major CMHC reports published concurrently for the first time, today: the Housing Market Assessment (HMA) and Housing Market Outlook (HMO).


According to the HMA, Canada now shows strong evidence of problematic conditions overall due to overvaluation and price acceleration. CMHC's last HMA report in July flagged the likelihood of seeing this evidence, by the fall. In addition, overvaluation continues to be detected in nine census metropolitan areas (CMAs) across the country and overbuilding in seven. The HMA serves as an early warning system, alerting Canadians to areas of concern developing in our housing markets, so that they may take action in a way that promotes market stability.


Meanwhile, the HMO highlights important regional differences in housing activity which will gradually dissipate over the forecast horizon. At the national level, housing starts and MLS® sales are expected to decline slightly in 2017 before stabilizing in 2018 to levels more consistent with economic fundamentals and demographic changes. The HMO is a forecasting tool which provides a range of possible outcomes to better help Canadians in their decision-making process.


Report Highlights

  • There is strong evidence of problematic conditions for Canada overall. Overvaluation and overbuilding remain prevalent concerns in several of Canada’s major housing markets. That said, housing starts and MLS® sales are expected to decline in 2017 and stabilize in 2018.
  • Housing demand in Vancouver is partially supported by robust employment growth, a growing population and low mortgage interest rates. These factors are expected to remain solid through 2018. That said, some moderation in housing starts and resales is forecast for 2017 and 2018, as the market continues to adjust to recent policy changes as well as an overvaluation of home prices. Price growth is also expected to slow, which should help to alleviate some of the imbalances currently detected by our HMA.
  • The Toronto housing market is showing strong evidence of problematic conditions, in part due to imbalances between house prices and fundamental drivers like incomes and population growth. These imbalances are expected to moderate through a slow-down in home price growth in 2017 and 2018 as factors such as rising mortgage rates and modest job growth later in the forecast period lead to resales moving off their record highs.
  • In the Prairie region this year, low commodity prices continue to impact investment, employment and housing demand. The result is slower new home construction as builders focus on selling their existing stock of new homes, especially multi-family units. Housing starts are forecasted to stabilize in 2017 as inventory reduction continues to hold back growth. By 2018, reduced inventories, stronger economic and employment growth will help boost new home construction
Read
Reciprocity Logo The data relating to real estate on this website comes in part from the MLS® Reciprocity program of either the Greater Vancouver REALTORS® (GVR), the Fraser Valley Real Estate Board (FVREB) or the Chilliwack and District Real Estate Board (CADREB). Real estate listings held by participating real estate firms are marked with the MLS® logo and detailed information about the listing includes the name of the listing agent. This representation is based in whole or part on data generated by either the GVR, the FVREB or the CADREB which assumes no responsibility for its accuracy. The materials contained on this page may not be reproduced without the express written consent of either the GVR, the FVREB or the CADREB.
