RSS

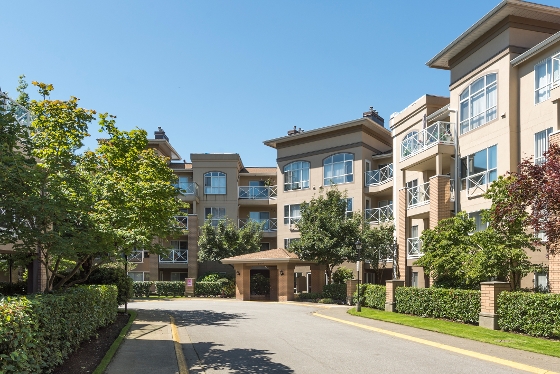
Fabulous! Fully renovated in 2015 by Interior Designer. Fully rain screened with newer roof with great family-oriented neighbourhood and meticulously managed strata with healthy contingency reserve fund. This high quality home features with beautiful gourmet kitchen completed with Quartz countertops, custom made cabinets, slick backsplashes, undermounted sink, newer flooring, designer paint, unique slate finised S/S appliances, frameless sliding bathtub doors, stone finished F/P, side wall & crown moldings, low water consumption toilets, and LED lighting throughout. Big enough patio for BBQ & various entertainment. Huge tandem parking on bsmt. Walking distance to schools, shopping, parks, West Coast Express, and easy access to Lougheed Hwy & Hwy #1.


Read

The Bank of Canada announced on October 19th, 2016 that it was keeping its trend-setting target overnight lending rate at 0.5 per cent.


The announcement and accompanying Monetary Policy Report (MPR) indicated that:


  • Canadian economic growth will be lower than previously expected, “due in large part to slower near-term housing resale activity and a lower [growth] trajectory for exports.”
  • The economy is now on track to “[return] to full capacity around mid-2018,” which is “materially later than Bank had anticipated in July.”
  • Recently tightened mortgage regulations will “likely restrain residential investment while dampening household vulnerabilities,” and “should mitigate risks to the financial system over time.”
  • Inflation remains well contained within the Bank’s target range.

As such, the Bank will keep interest rates on hold for at least another year and perhaps maybe even into 2018.

As of October 19th, 2016, the advertised five-year lending rate stood at 4.64 per cent, up 0.1 per cent from the previous Bank rate announcement on September 7th but unchanged from one year ago.

Read

The Bank of Canada today announced that it is maintaining its target for the overnight rate at 1/2 per cent. The Bank Rate is correspondingly 3/4 per cent and the deposit rate is 1/4 per cent.


The global economy is expected to regain momentum in the second half of this year and through 2017 and 2018. After a weak first half, the US economy in particular is strengthening: solid consumption is being underpinned by strong employment growth and robust consumer confidence. However, because of elevated uncertainty, US business investment is on a lower track than expected.


Looking through the choppiness of recent data, the profile for growth in Canada is now lower than projected in July’s Monetary Policy Report (MPR). This is due in large part to slower near-term housing resale activity and a lower trajectory for exports. The federal government’s new measures to promote stability in Canada’s housing market are likely to restrain residential investment while dampening household vulnerabilities. Recent export data are improving but are not strong enough to make up for ground lost during the first half of 2016, despite the effects of the Canadian dollar’s past depreciation. Growth in exports over 2017 and 2018 are projected to be slower than previously forecast, due to lower estimates of global demand, a composition of US growth that appears less favourable to Canadian exports, and ongoing competitiveness challenges for Canadian firms.


After incorporating these weaker elements, Canada’s economy is still expected to grow at a rate above potential starting in the second half of 2016, supported by accommodative monetary and financial conditions and federal fiscal measures. As the economy continues to adjust to the oil price shock, investment in the energy sector appears to be bottoming out. Non-resource activity is growing solidly, particularly in the services sector. Household spending continues to rise, along with employment and incomes outside of energy-intensive regions. The Bank expects Canada’s real GDP to grow by 1.1 per cent in 2016 and about 2 per cent in both 2017 and 2018. This projection implies that the economy returns to full capacity around mid-2018, materially later than the Bank had anticipated in July.


Measures of core inflation remain close to 2 per cent as the effects of past exchange rate depreciation and excess capacity continue to offset each other. Total CPI inflation is tracking slightly below expectations because of temporary weakness in prices for gasoline, food, and telecommunications. The Bank expects total CPI inflation to be close to 2 per cent from early 2017 onwards, when these temporary factors will have dissipated, but downward pressure on inflation will continue while economic slack persists.


Given the downward revision to the growth profile and the later closing of the output gap, the Bank considers the risks around its updated inflation outlook to be roughly balanced, albeit in a context of heightened uncertainty. Meanwhile, the new housing measures should mitigate risks to the financial system over time. At present, the Bank’s Governing Council judges that the overall balance of risks is still in the zone for which the current stance of monetary policy is appropriate, and the target for the overnight rate remains at 1/2 per cent

Read

Gorgeous views of Downtown & North Shore Mountains from every room. Enjoy beautiful sunsets and snow capped mountains in the winter. This 2bed+den/2bath/1108sqft home has it all: N/W facing, fresh paint, laminate floors, stunning views, an abundance of light, a functional plan, a spacious kitchen w/plenty of cupboard & counter space & breakfast bar, a cozy gas F/P, a massive covered balcony & much more. The master has excellent closet space, 4pc ensuite & balcony access. Benefit from a well sized 2nd bed, large den & lots of in-suite storage. The Polaris is a popular & well managed building complete w/gym, rec rm, hobby rm & manicured gardens. With a walk score of 89, the location can't beat! Act Now. Open Sat Oct 22 from 1 to 3.


Read

The decline in home sales in Vancouver which seems to have been exacerbated by the tax on foreign buyers, does not reflect the wider provincial housing market.

The British Columbia Real Estate Association says that, although there are other cities showing declining sales, there are also areas showing continued growth.

"Housing demand in the province continued to trend lower in September," said Cameron Muir, BCREA Chief Economist. "While Vancouver, Fraser Valley and the North experienced year-over-year declines last month, the rest of the province posted an increase in the number of residential transactions."

Overall sales across BC were down 11.2 per cent year-over-year in September and the average MLS price slipped 3.2 per cent to $585,844.

"The average residential price in the province continued to reflect a change in the composition and location of homes sold," added Muir. "However, the effect was less pronounced in September than in August, when detached home sales fell to just 28 per cent of total demand in Vancouver."

The year-to-date sales data shows a rise of 18.5 per cent compared to the same period of 2015; 93,797 units sold with an average sales price of $703,986, up 12.7 per cent year-over-year.

Read

Forget all the housing crash talk says a new report that suggests prices acceleration in Canada’s housing market will slow down without any hard landing.


Moody’s Analytics, which used the Brookfield RPS house price index for its models, maintains that prices in Canada will slow down as some markets, especially Vancouver and Toronto, see homes become overvalued and less affordable while international capital inflows slow down.


“We are predicting that the housing market will slow down, in terms of house price growth, significantly,” said Andrew Carbacho-Burgos, an economist with Moody’s Analytics who suggests national house price growth will drop  to about two per cent by the end of 2018, from about eight per cent now. “We definitely expect a cooling off led by Vancouver and Toronto.”


It could be bad news for smaller cities, which the advisory firm says will actually experience house price declines, adding that commodities prices could drive prices lower in cities in Alberta and Saskatchewan and in St. John’s, N.L.


The Moody’s report comes out as the head of Canada Mortgage and Housing Corp. said in column published Monday that his organization will issue a red warning card for the state of the Canadian housing market when it releases its third quarter report later this month.


“Concerns about elevated prices in Vancouver and Toronto are well-known,” wrote Evan Siddall, the chief executive of CMHC. “Affordability pressures hurt lower-income households the most and cause real socio-economic consequences. CMHC has recently observed spillover effects from Vancouver and Toronto into nearby markets. Those factors will be reflected in our forthcoming House Market Assessment on Oct. 26. They will cause us to issue our first red warning for the Canadian housing market as a whole.”


Siddall’s comments were largely backed up by a leading credit agency report that wondered whether the home ownership dream in Vancouver and Toronto was all but dead for the average buyer. In a report out Monday, DBRS Inc. said that, based on the gross debt service ratio cap of 39 per cent set by Ottawa — the percentage of your income required to cover all housing costs — both cities appear to be way out of reach for most households.


“One consequence stemming from the sharp house appreciation is that more and more Canadian residents are finding it difficult to achieve their home ownership dream,” noted DBRS, adding that, based on theoretical calculations using average price, average income and average five-year mortgage rates, the GDSR is 82 per cent in Vancouver and 50 per cent in Toronto.


Both Siddall’s comments and the DBRS report come on the same day that new federal mortgage rules — which will make it harder for consumers to borrow money by forcing them to qualify based on a much higher rate than the one on their contract — went into effect .


Phil Soper, the chief executive of Royal LePage Real Estate Services, applauded the government for rules cracking down on the misuse of the principal residence tax exemption, but questioned whether the government might be going too far in other ways.


“The housing industry continues to do the heavy lifting for the Canadian economy. And in our largest cities, we have these tax burdens,” said Soper, pointing to a double land transfer tax in Toronto and 15 per cent additional property transfer tax on foreign buyers in Vancouver. “All of these changes, whether they be municipal, provincial or federal, are all additive, and we have to be very, very careful that we don’t put too much of a drag on this primary engine of economic growth.”


Another factor that could be a major driver in slowing home price growth would be rising mortgage rates. Moody’s Analytics is expecting to see rates rise over the next two years as U.S. and Canadian monetary policy revert to pre-Great Recession norms.


Moody’s Carbacho-Burgos said he just can’t see the hard landing, which he defines as a national price decline of at least 10 per cent. However, his report was generated before the latest changes to mortgage rules in Canada, which tighten credit access.


“What we would expect, based on rule changes, is an exacerbating or cooling trend nationally. In particular Toronto, which will have much slower growth and its neighbouring areas as a result of the rule changes,” said Carbacho-Burgos. “But we don’t see any reversion to a house price crash.”


Garry Marr

Financial Post

Read

The British Columbia Real Estate Association (BCREA) reports that 7,591 residential unit sales were recorded by the Multiple Listing Service® (MLS®) in September, down 11.2 per cent from the same month last year. Total sales dollar volume was $4.45 billion in September, down 14.1 per cent compared to the previous year. The average MLS® residential price in the province was $585,844, a decline of 3.2 per cent compared to the same month last year.


“Housing demand in the province continued to trend lower in September,” said Cameron Muir, BCREA Chief Economist. “While Vancouver, Fraser Valley and the North experienced yearover- year declines last month, the rest of the province posted an increase in the number of residential transactions.”


“The average residential price in the province continued to reflect a change in the composition and location of homes sold,” added Muir. “However, the effect was less pronounced in September than in August, when detached home sales fell to just 28 per cent of total demand in Vancouver.”


Year-to-date, BC residential sales dollar volume increased 33.5 per cent to $66 billion, when compared with the same period in 2015. Residential unit sales climbed by 18.5 per cent to 93,797 units, while the average MLS® residential price was up 12.7 per cent to $703,986.

Read

Welcome to STATION HILL!! This beautiful bright and spacious 1 bed, 1 bath corner unit is a must see. Features include engineered hardwood flooring, granite countertops, stainless steel appliances, new carpet and insuite laundry. Large corner balcony, perfect for entertaining family and friends. This building also features amenity and fitness room. Comes with 1 parking and 1 storage locker. Steps from West Coast Express, Rec. Centre, Library, schools, Gates Park and shopping/restaurants in Downtown Port Coquitlam. Perfect for first time home buyer or investor. Call today to view. Open House Saturday Sept 17, 2-4pm.


Read

According to statistics released today by The Canadian Real Estate Association (CREA), national home sales edged slightly higher in September 2016 compared to August.


Highlights:

  • National home sales edged up 0.8% from August to September.
  • Actual (not seasonally adjusted) activity in September rose 4.2% year-over-year (y-o-y).
  • The number of newly listed homes ticked up 0.5% from August to September.
  • The MLS® Home Price Index (HPI) in September was up 14.4% y-o-y.
  • The national average sale price climbed 9.5% y-o-y.

The number of homes trading hands via Canadian MLS® Systems rose 0.8 percent month-over-month in September 2016. Having eased in each of the previous four months, national home sales are 5.6 percent below the record set in April 2016.


The number of markets was evenly split between those where activity rose on a month-over-month basis and those where it declined. Continuing recent trends, sales climbed further in and around the Greater Toronto Area (GTA) and fell further in and around the Lower Mainland of British Columbia.


As previously reported, Greater Vancouver and Fraser Valley home sales had retreated sharply for five months straight before the new foreign buyers’ tax in Metro Vancouver was announced in August. Activity has returned to more normal levels after having peaked at the start of this year. Indeed, most of the decline since the April peak in national sales reflects the rapid drop in activity in and around B.C.’s Lower Mainland.


“The Finance Minister’s recent changes to regulations affecting mortgage lending has added to housing market uncertainty among buyers and sellers,” said CREA President Cliff Iverson. “For first-time home buyers, the stress test for those who need mortgage default insurance will cause them to rethink how much home they can afford to buy.”


“First-time home buyers, particularly in housing markets with a lack of affordable inventory of single family homes, may be priced out of the market by the new regulations that take effect on October 17th,” said Gregory Klump, CREA’s Chief Economist. “First-time home buyers support a cascade of other homes changing hands, making them the linchpin of the housing market. The federal government will no doubt want to monitor the effect of new regulations on the many varied housing markets across Canada and on the economy, particularly given the uncertain outlook for other private sector engines of economic growth.”


Actual (not seasonally adjusted) sales activity was up 4.2 percent y-o-y in September 2016. Transactions were up from year-ago levels in almost two-thirds of all Canadian markets. Led by the GTA and environs, the increase was held in check by the drop in activity in B.C.’s Lower Mainland.


The number of newly listed homes inched up by 0.5 percent in September 2016 compared to August. As with sales activity, the number of markets where new listings were up on a month-over-month basis and those where they fell was evenly split. With inventory in acutely short supply, the rise in new listings supported higher sales activity in the GTA and the national total.


With sales and new listings having risen by similar magnitudes, the national sales-to-new listings ratio (62.1 percent) was little changed from August (61.9 percent) and remains well off the peak reached in May (65.3 percent).


A sales-to-new listings ratio between 40 and 60 percent is generally consistent with balanced housing market conditions, with readings below and above this range indicating buyers’ and sellers’ markets respectively.


The ratio was above 60 percent in almost half of all local housing markets in September, virtually all of which continue to be located in British Columbia, in and around the Greater Toronto Area and across Southwestern Ontario. However, the ratio has moved out of sellers’ market territory and into the mid-50 percent range in Greater Vancouver and the Fraser Valley.


The number of months of inventory is another important measure of the balance between housing supply and demand. It represents the number of months it would take to completely liquidate current inventories at the current rate of sales activity.


There were 4.7 months of inventory on a national basis at the end of September 2016. The measure has remained virtually unchanged since April, with fewer sales in the Lower Mainland counterbalanced by a shrinking supply of listings in and around the GTA.


The tight balance between housing supply and demand in Ontario’s Greater Golden Horseshoe region is without precedent (including the GTA, Hamilton-Burlington, Oakville-Milton, Guelph, Kitchener-Waterloo, Cambridge, Brantford, the Niagara Region, Barrie and nearby cottage country). The number of months of inventory ranges between one and two months in Greater Golden Horseshoe housing markets and is less than one month inside the GTA.


The Aggregate Composite MLS® HPI rose by 14.4 percent y-o-y in September 2016. Down from 14.7 percent in August this was the first deceleration since March 2015.


On a y-o-y basis, price growth throttled back for one-storey single family homes and apartment units and held steady for two-storey single family homes and townhouse/row units.


Townhouse/row unit and two-storey single family home posted the biggest y-o-y increases in September 2016 (16.4 percent and 16.3 percent respectively). Price increases were close behind for one-storey single family homes (14.0 percent) and apartment units (11.1 percent).


While prices in 9 of the 11 markets tracked by the MLS® HPI posted y-o-y gains in September, increases continue to vary widely among housing markets.


Greater Vancouver (+28. 2 percent) and the Fraser Valley (+35.0 percent) posted the largest y-o-y gains by a wide margin. However, single family home prices in both of these markets dropped from the month before, marking the first significant decline since late 2012.


Double-digit y-o-y percentage price gains were also registered in Greater Toronto (+18.0 percent), Victoria (+19.4 percent) and Vancouver Island (+13.9 percent).


By contrast, prices were down -4.1 percent y-o-y in Calgary. Although home prices there have held steady since May, they have remained below year-ago levels since August 2015 and are down 4.6 percent from the peak reached in January 2015.


Home prices also edged lower by 1.2 percent y-o-y in Saskatoon. Home prices in Saskatoon have also held below year-ago levels since August 2015.


Meanwhile, home prices posted additional y-o-y gains in Regina (+4.9 percent), Greater Moncton (+4.2 percent), Ottawa (+2.7 percent) and Greater Montreal (+2.7 percent).


The MLS® Home Price Index (MLS® HPI) provides the best way of gauging price trends because average price trends are prone to being strongly distorted by changes in the mix of sales activity from one month to the next.

The actual (not seasonally adjusted) national average price for homes sold in September 2016 was up 9.5 percent y-o-y to $474,590.


The national average price continues to be pulled upward by sales activity in Greater Vancouver and Greater Toronto, which remain two of Canada’s tightest, most active and expensive housing markets.


That said, Greater Vancouver’s share of national sales activity has diminished considerably of late, resulting in it having less upward influence on the national average price. Even so, the average price is reduced by more than $100,000 to $358,884 if Greater Vancouver and Greater Toronto sales are excluded from calculations.

Read

Bright, spacious & a unique plan await you in this Greenbelt 2bed/2bath/1118sqft corner unit-home; tastefully renovated throughout, you won't be disappointed. Located in popular Crescent on the Reeve Creek offering easy Hwy access & walking distance to parks, schools, recreation & tons of amenities. Features: welcoming entrance, fully reno'ed main bath, laminate floors & new carpeting throughout, newer SS apps, full size W/D, updated kitchen with loads of cupboard & counter space, gorgeous rock faced gas F/P & more. The large master has room for king size bed & extra storage plus a walkin & 4 piece ensuite. Benefit from a well sized second bed w/plenty of closet space. Includes parking & storage. Act now. OPEN HOUSE Oct. 15 & 16 from 2 to 4.


Read

The trend measure of housing starts in Canada was 199,503 units in September compared to 196,465 in August, according to Canada Mortgage and Housing Corporation (CMHC). The trend is a six-month moving average of the monthly seasonally adjusted annual rates (SAAR) of housing starts.


“Housing starts were on an upward trend in September, as residential construction increased across the country with the exception of Ontario, where the multiples segment softened to levels that are more consistent with household formation," said Bob Dugan, CMHC Chief Economist. “Quebec saw the largest gain in housing starts due to the development of new rental apartments intended for seniors. That said, Quebec’s growing apartment stock emphasizes the importance of inventory management.”


CMHC uses the trend measure as a complement to the monthly SAAR of housing starts to account for considerable swings in monthly estimates and obtain a more complete picture of the state of Canada’s housing market. In some situations analyzing only SAAR data can be misleading, as they are largely driven by the multi-unit segment of the market which can vary significantly from one month to the next.


The standalone monthly SAAR for all areas in Canada was 220,617 units in September, up from 184,201 units in August. The SAAR of urban starts increased by 19.7 per cent in September to 201,848 units. Multiple urban starts increased by 22.3 per cent to 137,803 units in September and single-detached urban starts increased by 14.5 per cent to 64,045 units.


In September, the seasonally adjusted annual rate of urban starts increased in British Columbia, Quebec, the Prairies, and in Atlantic Canada, but decreased in Ontario.


Rural starts were estimated at a seasonally adjusted annual rate of 18,769 units.

Read

Metro Vancouver* home sales dipped below the 10- year monthly sales average last month. This is the first time this has occurred in the region since May 2014.


Metro Vancouver home sales totalled 2,253 in September 2016, a decrease of 32.6 per cent from the 3,345 sales recorded in September 2015 and a decrease of 9.5 per cent compared to August 2016 when 2,489 homes sold. 


Last month’s sales were 9.6 per cent below the 10-year sales average for the month.


“Supply and demand conditions differ today depending on property type,” Dan Morrison, REBGV president said. “We’re seeing more demand for condominiums and townhomes today than in the detached home market.”


New listings for detached, attached and apartment properties in Metro Vancouver totalled 4,799 in September 2016. This represents a decrease of one per cent compared to the 4,846 units listed in September 2015 and an 11.8 per cent increase compared to August 2016 when 4,293 properties were listed.


The total number of homes currently listed for sale on the MLS® system in Metro Vancouver is 9,354, a 13.4 per cent decline compared to September 2015 (10,805) and a 10 per cent increase compared to August 2016 (8,506).


The sales-to-active listings ratio for September 2016 is 24.1 per cent. This is the lowest this ratio has been since February 2015. Generally, analysts say that downward pressure on home prices occurs when the ratio dips below the 12 per cent mark, while home prices often experience upward pressure when it reaches the 20 to 22 per cent range in a particular community for a sustained period.


“Changing market conditions are easing upward pressure on home prices in our region,” Morrison said. “There’s uncertainty in the market at the moment and home buyers and sellers are having difficulty establishing price as a result. To help you understand the factors affecting prices, it’s important to talk with a REALTOR®.”


The MLS® Home Price Index composite benchmark price for all residential properties in Metro Vancouver is currently $931,900. This represents a 28.9 per cent increase compared to September 2015 and a 0.1 per cent decline compared to August 2016.


Sales of detached properties in September 2016 reached 666, a decrease of 47.6 per cent from the 1,272 detached sales recorded in September 2015. The benchmark price for detached properties is $1,579,400. This represents a 33.7 per cent increase compared to September 2015 and a 0.1 per cent increase compared to August 2016.


Sales of apartment properties reached 1,218 in September 2016, a decrease of 20.3 per cent compared to the 1,529 sales in September 2015.The benchmark price of an apartment property is $511,800. This represents a 23.5 per cent increase compared to September 2015 and a 0.5 per cent decline compared to August 2016.


Attached property sales in September 2016 totalled 369, a decrease of 32.2 per cent compared to the 544 sales in September 2015. The benchmark price of an attached unit is $677,000. This represents a 29.1 per cent increase compared to September 2015 and a 0.1 per cent decline compared to August 2016.

Read
Reciprocity Logo The data relating to real estate on this website comes in part from the MLS® Reciprocity program of either the Greater Vancouver REALTORS® (GVR), the Fraser Valley Real Estate Board (FVREB) or the Chilliwack and District Real Estate Board (CADREB). Real estate listings held by participating real estate firms are marked with the MLS® logo and detailed information about the listing includes the name of the listing agent. This representation is based in whole or part on data generated by either the GVR, the FVREB or the CADREB which assumes no responsibility for its accuracy. The materials contained on this page may not be reproduced without the express written consent of either the GVR, the FVREB or the CADREB.