RSS

Just Sold: 307 9262 University Cr., Burnaby, Burnaby North, SFU

Spacious & Open Layout

Lush Forest Outlook

2 Bed + Den, 2 Bath, 1024sqft

Priced at $598,800


Click here for more...


Bright, spacious and very private. Just a few ways to describe this immaculate one-owner home. Welcome to a 2 bed + den, 2 bath, 1024sqft home with lush forest outlook that breaks away during winter months to allow for plenty of natural light. Located in Novo II, a concrete building found in UniverCity; Vancouver's premier lifestyle neighborhood, allowing for rentals and pets. Features: new flooring, new dishwasher, open layout, plenty of counter and cupboard space, island w/breakfast bar, covered balcony and more. The spacious master has 3pc ensuite & large closet space. The 2nd bedroom is well sized. Bonus open den; perfect for home office, 1 parking & locker. Close to: transit, shopping, indoor/outdoor rec. & a host of perks available only to UniverCity residents. Act Now!

Read

Canadian housing starts trended lower in September

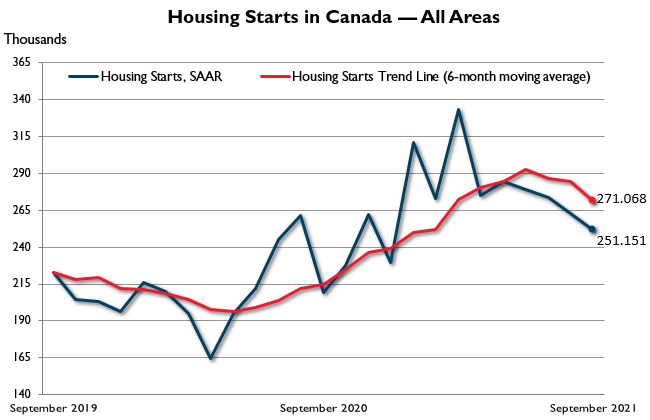
The trend in housing starts was 271,068 units in September 2021, down from 284,757 units in August 2021, according to Canada Mortgage and Housing Corporation (CMHC). This trend measure is a six-month moving average of the monthly seasonally adjusted annual rates (SAAR) of housing starts.


“The six-month trend in housing starts declined from August to September, with total starts continuing to pull back from their earlier 2021 levels,” said Bob Dugan, CMHC's chief economist. “Single-detached and multi-family SAAR starts were both lower in Canada’s urban areas in September, which led to a decline in overall SAAR starts for the month. On a trend and monthly SAAR basis, however, the level of housing starts activity in Canada remains high in historical terms. Among Vancouver, Toronto and Montreal, Vancouver was the only market not to register growth in total SAAR starts in September, due to a decline in the multi-family segment.”


CMHC uses the trend measure as a complement to the monthly SAAR of housing starts to account for considerable swings in monthly estimates and obtain a more complete picture of Canada’s housing market. In some situations, analyzing only SAAR data can be misleading, as the multi-unit segment largely drives the market and can vary significantly from one month to the next.


The standalone monthly SAAR of housing starts for all areas in Canada was 251,151 units in September, a decrease of 4.4% from 262,754 units in August. The SAAR of urban starts decreased by 4.5% in September to 223,055 units. Multiple urban starts decreased by 4% to 165,861 units in September, while single-detached urban starts decreased by 5.9% to 57,194 units.


Rural starts were estimated at a seasonally adjusted annual rate of 28,096 units.


Click here for more...


Provided by: CMHC

Read

Canadian home prices continue to re-accelerate in September

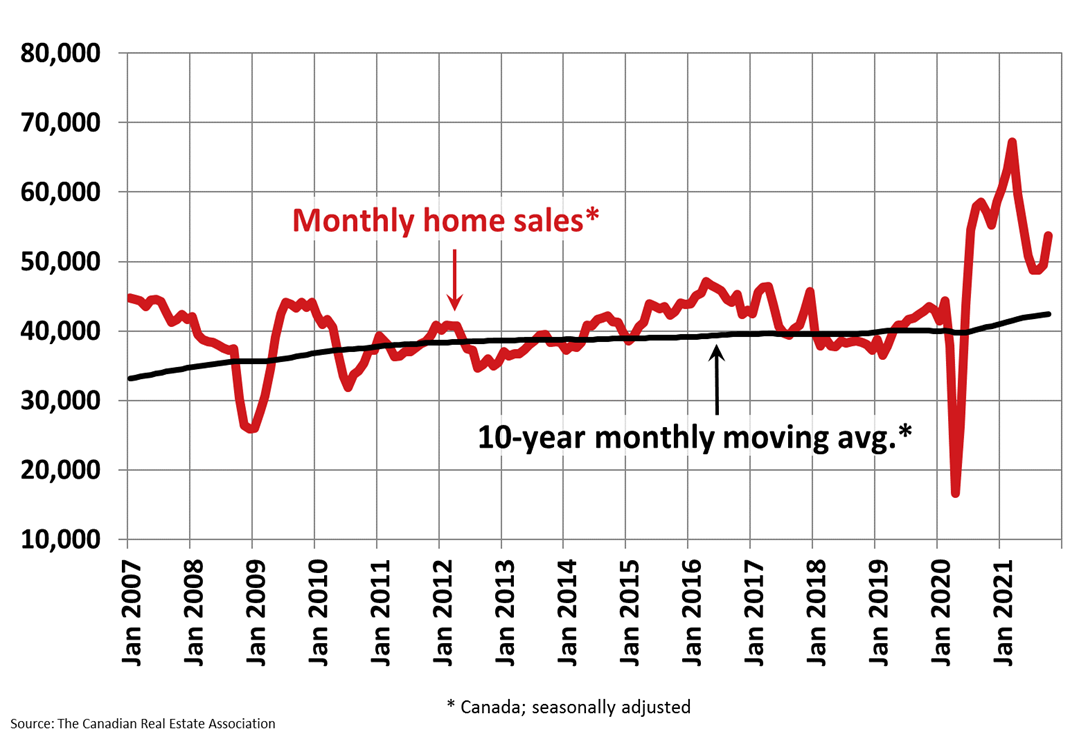
Statistics released today by the Canadian Real Estate Association (CREA) show national home sales edged up between August and September 2021.

Highlights:


  • National home sales rose 0.9% on a month-over-month basis in September.
  • Actual (not seasonally adjusted) activity was down 17.5% on a year-over-year basis.
  • The number of newly listed properties declined by 1.6% from August to September.
  • The MLS® Home Price Index (MLS® HPI) rose 1.7% month-over-month and was up 21.5% year-over-year.
  • The actual (not seasonally adjusted) national average sale price posted a 13.9% year-over-year gain in September.

Home sales recorded over Canadian MLS® Systems were up 0.9% between August and September 2021, marking the first monthover-month increase since March.


The actual (not seasonally adjusted) number of transactions in September 2021 was down 17.5% on a year-over-year basis, from the record for that month set last year. That said, it was still the second-highest ever September sales figure by a sizeable margin.


“September provided another month’s worth of evidence from all across Canada that housing market conditions are stabilizing near current levels,” said Cliff Stevenson, Chair of CREA. “In some ways that comes as a relief given the volatility of the last year-and-a-half, but the issue is that demand/supply conditions are stabilizing in a place that very few people are happy about. There is still a lot of demand chasing an increasingly scarce number of listings, so this market remains very challenging. That’s why your best bet is to consult with your local REALTOR® for information and guidance about navigating the current market,” continued Stevenson.


“The small changes observed in most key housing market metrics over the last couple of months suggest that the worst of the pandemic-related volatility we’ve experienced since last spring is in the rear-view mirror at this point,” said Shaun Cathcart, CREA’s Senior Economist. “Having said that, given we are still stuck at around 2 months of inventory nationally, the thing to keep a close eye on going forward will be the behaviour of prices. While the acceleration in home prices we saw in September was more than most would have expected, the fact that prices are now moving back in that direction is not surprising.”


The number of newly listed homes fell by 1.6% in September compared to August, as gains in parts of Quebec were overwhelmed by declines in the Lower Mainland, in and around the GTA and in Calgary.


With sales up and new listings down in September, the sales-to-new listings ratio tightened to 75.1% compared to 73.2% in August. The long-term average for the national sales-to-new listings ratio is 54.8%.


Based on a comparison of sales-to-new listings ratio with long-term averages, a small but growing majority of local markets are moving back into seller’s market territory. As of September it was close to a 60/40 split between seller’s and balanced markets.


There were 2.1 months of inventory on a national basis at the end of September 2021, down slightly from 2.2 months in August and 2.3 months in June and July. This is extremely low and indicative of a strong seller’s market at the national level and in most local markets. The long-term average for this measure is more than 5 months.


In line with tighter market conditions, the Aggregate Composite MLS® Home Price Index (MLS® HPI) accelerated to 1.7% on a month-over-month basis in September 2021.


The non-seasonally adjusted Aggregate Composite MLS® HPI was up 21.5% on a year-over-year basis in September, up a bit from the 21.3% year-over-year gain recorded in August. (Chart B)


Looking across the country, year-over-year price growth is creeping up above 20% in B.C., though it is lower in Vancouver, on par with the provincial number in Victoria, and higher in other parts of the province.


Year-over-year price gains are in the mid-to-high single digits in Alberta and Saskatchewan, while gains are into the low double-digits in Manitoba.


Ontario saw year-over-year price growth pushing 25% in September; however, as with B.C. big, medium and smaller city trends, gains are notably lower in the GTA and Ottawa, around the provincial average in Oakville-Milton, Hamilton-Burlington and Guelph, and considerably higher in many of the smaller markets around the province.


Greater Montreal’s year-over-year price growth remains at a little over 20%, while Quebec City is now at 13%. Price growth is running a little above 30% in New Brunswick (higher in Greater Moncton, a little lower in Fredericton and Saint John), while Newfoundland and Labrador is now at 12% year-over-year (a bit lower in St. John’s).


The MLS® HPI provides the best way to gauge price trends because averages are strongly distorted by changes in the mix of sales activity from one month to the next.


The actual (not seasonally adjusted) national average home price was $686,650 in September 2021, up 13.9% from the same month last year. The national average price is heavily influenced by sales in Greater Vancouver and the GTA, two of Canada’s most active and expensive housing markets. Excluding these two markets from the calculation in September 2021 cuts over $146,000 from the national average price.


Provided by: CREA

Read

Top 10 September 2021

I am greatful for each and everyone of my clients as their support  and trust in me has enabled me to be succesful in my real estate business, thank you! Congrats to all the other top 10 realtors. 

Read

Record-Low Supply Keeps Market Conditions Tight in September

The British Columbia Real Estate Association (BCREA) reports that a total of 9,164 residential unit sales were recorded by the Multiple Listing Service® (MLS®) in September 2021, a decrease of 19.9 per cent from September 2020. The average MLS® residential price in BC was $913,471, a 14 per cent increase from $801,241 recorded in September 2020. Total sales dollar volume was $8.4 billion, an 8.6 per cent decline from last year.


“Home sales have settled at levels that are slightly above long-term average,” said BCREA Chief Economist Brendon Ogmundson. “The main story in all markets continues to be a severe lack of listings supply, particularly in Fraser Valley, Vancouver Island and Interior markets.”


Total active residential listings were down 36.8 per cent year-over-year in September for the province as a whole and were more than more than 50 per cent below last September’s levels in the Fraser Valley and Victoria.


Year-to-date, BC residential sales dollar volume was up 81.8 per cent to $90.4 billion, compared to the same period in 2020. Residential unit sales were up 52.4 per cent to 99,182 units, while the average MLS® residential price was up 19.3 per cent to $911,195.


Click here for more...


Provided by: BCREA

Read

Just Sold: 207 1135 Windsor Mews., Coquitlam, New Horizons


This well cared for home is waiting for a new family to love it and enjoy the relaxed lifestyle of the Windsor Gate community. Bright and spacious excellent layout over 1,000 sqft & tons of natural light, sought after back unit, morning sun, cool evenings, no traffic, peace & quiet. Gourmet kitchen, great for the home chef & family dinners. Big master bedroom w/walk in closet, walk in shower w/separate bath, double sinks. Stroll to the resort like clubhouse with space to socialize, play sports, swim or relax in the sauna. Two parking spots and a good size locker make this an ideal retreat for a busy couple or family. Minutes to Coquitlam Cnt,Glen Park, Lincoln Skytrain, all levels of excellent schools. Come and view, you'll love this home. 


Listing Offered by: Evergreen West Realty

Read

Just Sold: 842 Runnymede Ave., Coquitlam, Coquitlam West


Perfect place to Build your Dream Home! Large lot with Sunny backyard. Quiet Central location on a wonderful family oriented area. Close to Transit, Lougheed Town Centre, Skytrain, Vancouver Golf Club, SFU and much more. Possible future zoning changes/ Development opportunities. Call for more details.


Listing Offered by: Oakwyn Realty Encore

Read

Elevated home sale activity continues to outstrip the supply of  homes for sale in Metro Vancouver

Home sale activity remains elevated across Metro Vancouver’s* housing market while the pace of homes being listed for sale continues to follow long-term averages.


The Real Estate Board of Greater Vancouver (REBGV) reports that residential home sales in the region totalled 3,149 in September 2021, a 13.6 per cent decrease from the 3,643 sales recorded in September 2020, and a 0.1 per cent decrease from the 3,152 homes sold in August 2021.

Last month’s sales were 20.8 per cent above the 10-year September sales average.


There were 5,171 detached, attached and apartment properties newly listed for sale on the Multiple Listing Service® (MLS®) in Metro Vancouver in September 2021. This represents a 19.2 per cent decrease compared to the 6,402 homes listed in September 2020 and a 28.2 per cent increase compared to August 2021 when 4,032 homes were listed.


September’s new listings were 1.2 per cent below the 10-year average for the month.


“The summer trend of above-average home sales and historically typical new listings activity continued in Metro Vancouver last month. Although this is keeping the overall supply of homes for sale low, we’re not seeing the same upward intensity on home prices today as we did in the spring,” Keith Stewart, REBGV economist said. “Home price trends will, however, vary depending on property type and neighborhood, so it’s important to take a hyperlocal look at your location and property category of choice before making a home buying or selling decision.”


The total number of homes currently listed for sale on the MLS® system in Metro Vancouver is 9,236. This is a 29.5 per cent decrease compared to September 2020 (13,096), a 2.6 per cent increase compared to August 2021 (9,005) and is 27.7 per cent below the 10-year average for the month.


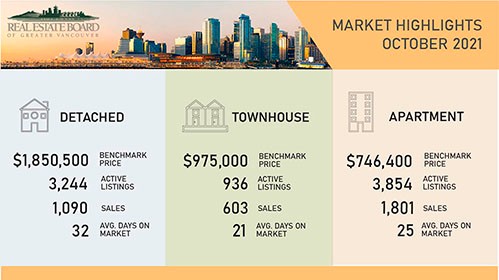
For all property types, the sales-to-active listings ratio for September 2021 is 34.1 per cent. By property type, the ratio is 25.5 per cent for detached homes, 53.1 per cent for townhomes, and 36.7 per cent for apartments. Generally, analysts say downward pressure on home prices occurs when the ratio dips below 12 per cent for a sustained period, while home prices often experience upward pressure when it surpasses 20 per cent over several months.


“The total inventory of homes for sale remains insufficient to meet the demand in today’s market. This scarcity limits peoples’ purchasing options and ultimately adds upward pressure on home prices,” Stewart said. “With the federal election now behind us, we hope to see governments at all levels work with the construction industry to streamline the creation of a more abundant and diverse supply of housing options.”


The MLS® Home Price Index composite benchmark price for all residential properties in Metro Vancouver is currently $ 1,186,100. This represents a 13.8 per cent increase over September 2020 and a 0.8 per cent increase compared to August 2021.


Sales of detached homes in September 2021 reached 950, a 27.9 per cent decrease from the 1,317 detached sales recorded in September 2020. The benchmark price for a detached home is $1,828,200. This represents a 20.4 per cent increase from September 2020 and a 1.2 per cent increase compared to August 2021.


Sales of apartment homes reached 1,621 in September 2021, a 1.6 per cent increase compared to the 1,596 sales in September 2020. The benchmark price of an apartment home is $738,600. This represents an 8.4 per cent increase from September 2020 and a 0.5 per cent increase compared to August 2021.


Attached home sales in September 2021 totalled 578, a 20.8 per cent decrease compared to the 730 sales in September 2020. The benchmark price of an attached home is $963,800. This represents a 17.5 per cent increase from September 2020 and a 1.2 per cent increase compared to August 2021.


Click here for more...


Provided by: REBGV

Read

Home price acceleration, alongside continued overvaluation, as home prices further detach from fundamental factors, such as labour income, has created a high degree of vulnerability in Canada’s housing market. This according to the latest Housing Market Assessment released by Canada Mortgage and Housing Corporation (CMHC). High vulnerability at the national level is largely a reflection of problematic conditions in several local housing markets across Ontario and Eastern Canada. A high degree of vulnerability means the housing market is more vulnerable to a potential downturn, with greater consequences if the downturn were to happen.


Historically low interest rates, government supports, and the rollout of mass vaccination programs provided higher purchasing power, disposable income levels, and employment amongst Canadians in the first half of 2021, however, recent home price growth was not fully explained by these improving housing market fundamentals.


“Exceptionally strong demand and home price appreciation through the course of the pandemic may have contributed to increased expectations of continued price growth for homebuyers in several local housing markets across Ontario and Eastern Canada,” said Bob Dugan, CMHC’s chief economist. “This, in turn, may have caused more buyers to enter the market than was warranted.”


The number of home sales in Canada reached a historic high in the first quarter of 2021, with demand far outpacing the supply of available homes. Sales moderated in the second quarter of 2021, albeit to a still historically elevated level, with market overheating still detected at the national level.


There is low evidence of excess inventories in the national housing market. This means there is not an unusually high level of vacant, newly built, and unsold housing units. As well, the rental apartment vacancy rate is not significantly above normal levels.


click here for more...


Provided by: CMHC

Read

Just Listed: 307 9262 University Cr., Burnaby, Burnaby North, SFU

Spacious & Open Layout

Lush Forest Outlook

2 Bed + Den, 2 Bath, 1024sqft

Priced at $598,800


Click here for more...


Bright, spacious and very private. Just a few ways to describe this immaculate one-owner home. Welcome to a 2 bed + den, 2 bath, 1024sqft home with lush forest outlook that breaks away during winter months to allow for plenty of natural light. Located in Novo II, a concrete building found in UniverCity; Vancouver's premier lifestyle neighborhood, allowing for rentals and pets. Features: new flooring, new dishwasher, open layout, plenty of counter and cupboard space, island w/breakfast bar, covered balcony and more. The spacious master has 3pc ensuite & large closet space. The 2nd bedroom is well sized. Bonus open den; perfect for home office, 1 parking & locker. Close to: transit, shopping, indoor/outdoor rec. & a host of perks available only to UniverCity residents. Act Now!

Read

Just Sold: 102 9300 University Cr., Burnaby, Burnaby North, SFU

Two Level One University Home

Updated Throughout

4 bed, 3 bath, 1739sqft

Priced at $998,000


Click here for more...


Nestled in a gorgeous, forested outlook, this unique and amazing 4bed/3bath/1739sqft/2level home, located at One University Crescent, SFU's flagship development, will not disappoint! Features: freshly painted, new flooring throughout, over height ceilings on main lvl, expansive windows, open living & dining areas, update kitchen w/quartz counters, newer appls, tile backsplash, refaced cupboards & direct access to a massive partially covered patio. The large master has pass through closets & 5 pc ensuite. The 2nd & 3rd rooms are well sized. Down: 1bed suite w/separate entry, cooking area, laundry hook-up & patio; perfect mortgage helper or for multi-gen families. Close to: transit, shopping, indoor/outdoor rec. & a host of UniverCity resident only perks. Act Now! Call for showing details.

Read

BC Home Sales Returning to Normal While Supply Hits Record Low


The British Columbia Real Estate Association (BCREA) reports that a total 9,507 residential unit sales were recorded by the Multiple Listing Service® (MLS®) in August 2021, a decrease of 7.1 per cent over August 2020. The average MLS® residential price in BC was $901,712, a 17.2 per cent increase from $769,691 recorded in August 2020. Total sales dollar volume was $8.6 billion, an 8.9 per cent increase from last year.


“Home sales around the province have essentially returned to normal after a record setting spring,” said BCREA Chief Economist Brendon Ogmundson. “However, we continue to see a drought in the total supply of listings as well as downward trend in new listings activity.”


Total active residential listings were down 37.9 per cent yearover-year in August and were 42 per cent below normal levels for the month of August.


Year-to-date, BC residential sales dollar volume was up 102.2 per cent to $82 billion, compared with the same period in 2020. Residential unit sales were up 67.8 per cent to 89,980 units, while the average MLS® residential price was up 20.5 per cent to $911,245.


Click here for more...

Provided By: BCREA

Read
Reciprocity Logo The data relating to real estate on this website comes in part from the MLS® Reciprocity program of either the Greater Vancouver REALTORS® (GVR), the Fraser Valley Real Estate Board (FVREB) or the Chilliwack and District Real Estate Board (CADREB). Real estate listings held by participating real estate firms are marked with the MLS® logo and detailed information about the listing includes the name of the listing agent. This representation is based in whole or part on data generated by either the GVR, the FVREB or the CADREB which assumes no responsibility for its accuracy. The materials contained on this page may not be reproduced without the express written consent of either the GVR, the FVREB or the CADREB.