RSS

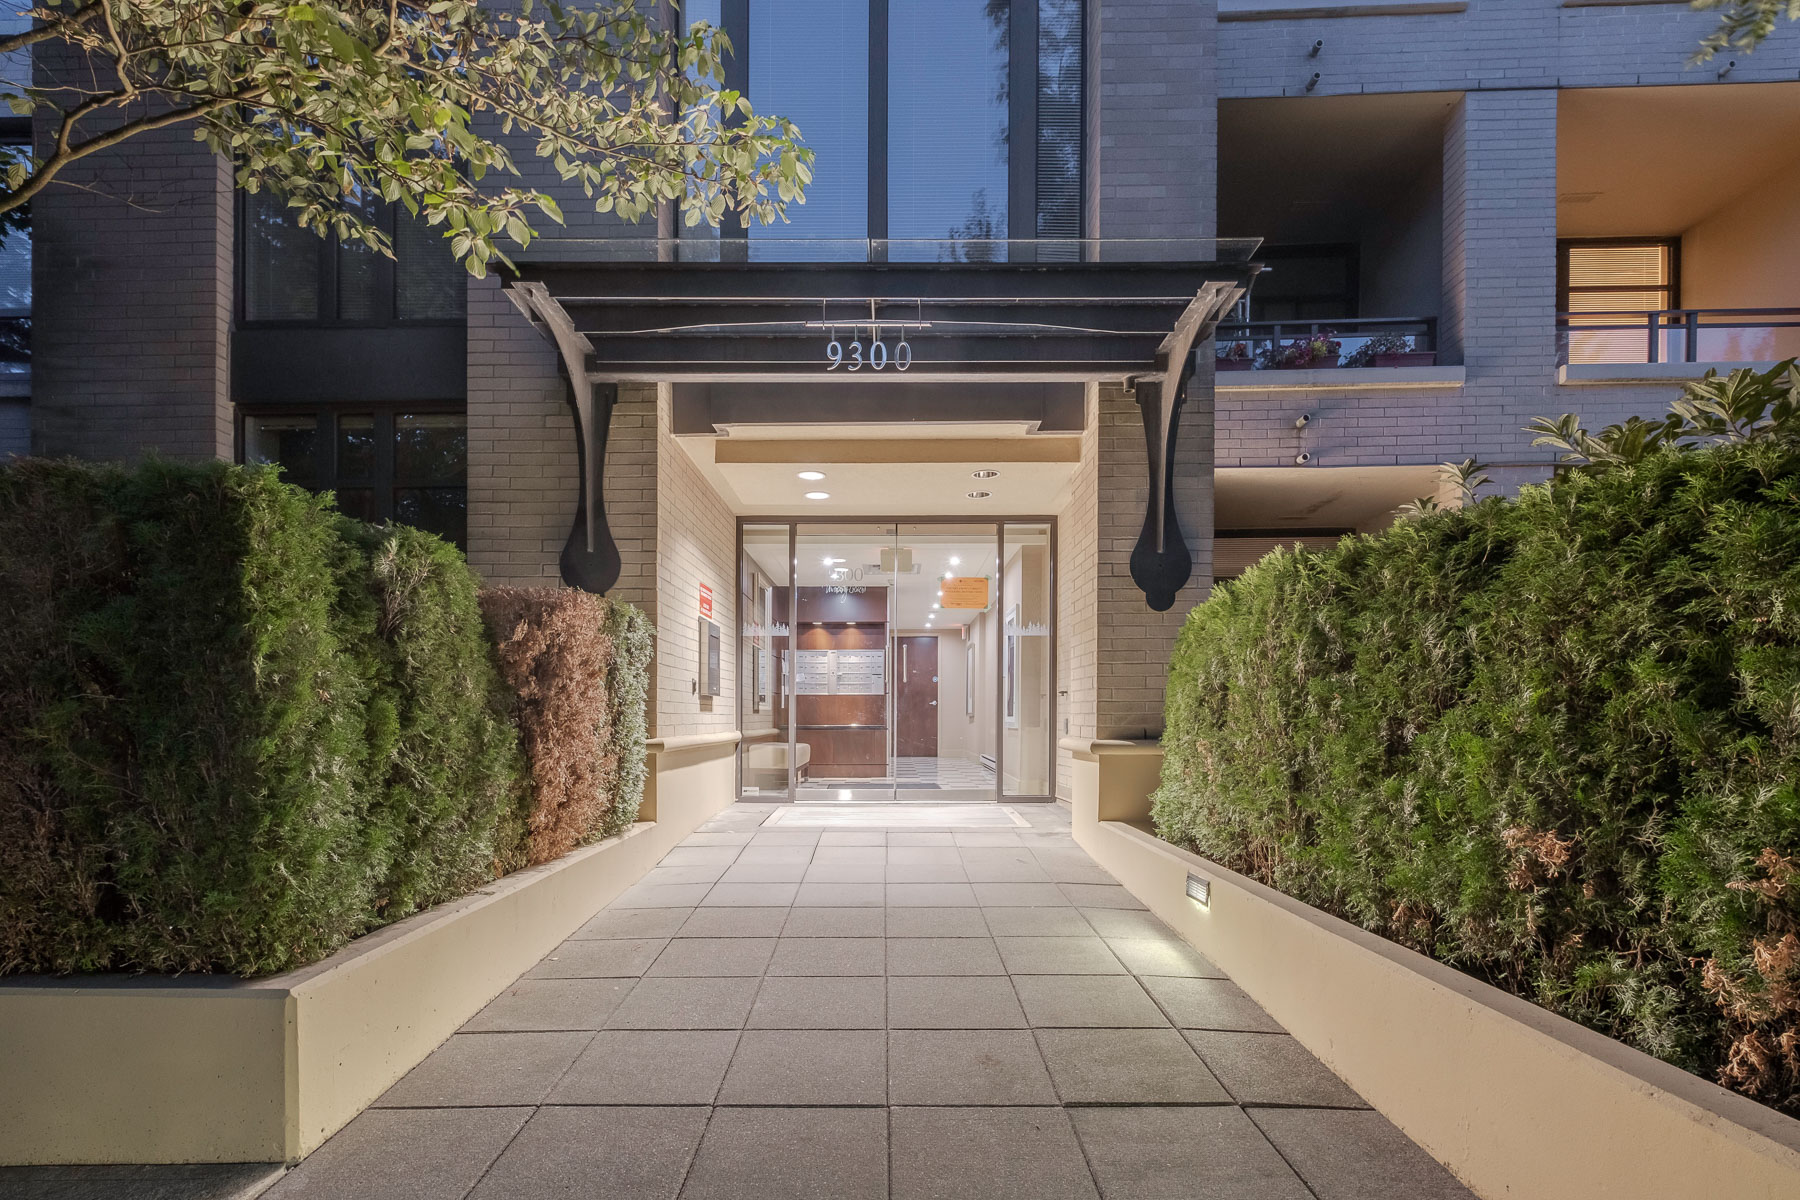
Just Listed: 705 9009 Cornerstone Mews, Burnaby, SFU

Rental and Pet Friendly

1 Bed + Den, 1 Bath, 621sqft

$474,800


Gorgeous endless South facing views. Huge partially covered roof-top deck. Top floor penthouse home! Your search ends here! Located in the "The Heart" of SFU, UniverCity, in The Hub, a concrete building. This 1 bed + large den with a window, 1 bath, 608sqft home is perfect for investors, first time buyers, students & everyone else in between. Features: a spacious plan, an open North/South exposure with no shared hallways, plenty of natural light, wood floors, a kitchen with SS apps, quartz counters & plenty of cupboards. The well sized master offers excellent closet space & large windows looking out to the covered balcony. Close to: transit, shopping, indoor/outdoor rec & a host of perks available only to UniverCity residents. Bonus: 1 parking, locker & rental & pet friendly. Act Now.


Click here for more details...

Read

Steady sales, reduced listings and virtually unchanged home prices in July

VANCOUVER, BC – August 4, 2021 – Metro Vancouver’s* housing market saw more moderate sales, listings and pricing trends in July compared to the heightened activity experienced throughout much of the pandemic. 


The Real Estate Board of Greater Vancouver (REBGV) reports that residential home sales in the region totalled 3,326 in July 2021, a 6.3 per cent increase from the 3,128 sales recorded in July 2020, and an 11.6 per cent  decrease from the 3,762 homes sold in June 2021.


Last month’s sales were 13.3 per cent above the 10-year July sales average. “Moderation was the name of the game in July,” said REBGV’s economist Keith Stewart. “Home sales and listings fell in line with typical seasonal patterns as summer got going in earnest in July. On top of moderating market activity, price growth has leveled off in most areas
and home types.” 


There were 4,377 detached, attached and apartment homes newly listed for sale on the Multiple Listing Service® (MLS®) in Metro Vancouver in July 2021. This represents a 26.4 per cent decrease compared to the 5,948 homes listed in July 2020 and a 25.2 per cent decrease compared to June 2021 when 5,849 homes were listed.

July’s new listings were 12.3 per cent below the 10-year average for the month. The total number of homes currently listed for sale on the MLS® system in Metro Vancouver is 9,850, an 18.5 per cent decrease compared to July 2020 (12,083) and a 9.1 per cent decrease compared to June 2021 (10,839).


“Low housing supply remains a fundamental factor in Metro Vancouver’s housing market,” Stewart said. "Home sales remain above average and we’re starting to see price increases relent as well. Going forward, the supply of homes for sale will be among the most critical factors to watch. This will determine the next direction for house price trends."


For all property types, the sales-to-active listings ratio for July 2021 is 33.8 per cent. By property type, the ratio is 25.5 per cent for detached homes, 47.8 per cent for townhomes, and 37.3 per cent for apartments. Generally, analysts say downward pressure on home prices occurs when the ratio dips below 12 per cent for a sustained period, while home prices often experience upward pressure when it surpasses 20 per cent over several months.


The MLS® Home Price Index composite benchmark price for all residential properties in Metro Vancouver is currently $1,175,500. This represents a 13.8 per cent increase over July 2020 and is unchanged from June 2021.


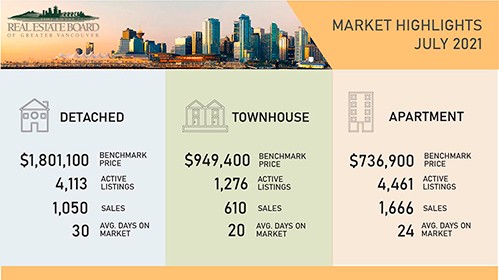
Sales of detached homes in July 2021 reached 1,050, a 6.3 per cent decrease from the 1,121 detached sales recorded in July 2020. The benchmark price for a detached home is $1,801,100. This represents a 21 per cent increase from July 2020 and is unchanged from June 2021.


Sales of apartment homes reached 1,666 in July 2021, a 19 per cent increase compared to the 1,400 sales in July 2020. The benchmark price of an apartment property is $736,900. This represents an 8.4 per cent increase from July 2020 and a 0.1 per cent decrease compared to June 2021. 


Attached home sales in July 2021 totalled 610, a 0.5 per cent increase compared to the 607 sales in July 2020. The benchmark price of an attached home is $949,400. This represents a 16.7 per cent increase from July 2020 and a 0.3 per cent increase compared to June 2021. 


*Editor’s Note: Areas covered by the Real Estate Board of Greater Vancouver include: Burnaby, Coquitlam, Maple Ridge, New Westminster, North Vancouver, Pitt Meadows, Port Coquitlam, Port Moody, Richmond, South Delta, Squamish, Sunshine Coast, Vancouver, West Vancouver, and Whistler. 


The real estate industry is a key economic driver in British Columbia. In 2020, 30,944 homes changed ownership in the Board’s area, generating $2.1 billion in economic spin-off activity and an estimated 14,728 jobs. The total  dollar value of residential sales transacted through the MLS® system in Greater Vancouver totalled $33.7 billion in 2020. The Real Estate Board of Greater Vancouver is an association representing more than 14,000 REALTORS® and their companies. The Board provides a variety of member services, including the Multiple Listing Service®. For
more information on real estate, statistics, and buying or selling a home, contact a local REALTOR® or visit www.rebgv.org.

Read

Just Listed: 1507 3980 Carrigan Crt, Burnaby, Government Road

Gorgeous Views

A Location to Beat

1281sqft, 2 Bed & 2 Bath

Priced at $638,800


Click here for more...


Stunning South/East 180 degree endless views. Soaring on the 15th story of popular Discovery Place next to The City of Lougheed is this 2bed/2bath/1281sqft home that will not disappoint. Features: a bright & spacious layout, welcoming entrance, hardwood floors, updated kitchen cabinets & counters, excellent sized living & dining rooms, crown moldings & huge covered balcony; perfect for year-round use. The generous sized master has its own balcony, walk-in closet & updated 5pc ensuite. 2nd bed is well sized with cheater ensuite. Bonus: 1 parking & locker, newer roof, water risers & elevator motor. Don't forget: indoor pool, gym, racket ball court & games rooms. Close to: Skytrain, shopping, recreation, transit & every amenity you could need. Act now! Call for a private showing..

Read

Housing market continues to moderate in June


Statistics released today by the Canadian Real Estate Association (CREA) show national home sales were down between May and June 2021.


Summary:

  • National home sales declined by 8.4% on a month-over-month basis in June.
  • Actual (not seasonally adjusted) activity was up 13.6% year-over-year.
  • The number of newly listed properties edged back by 0.7% from May to June.
  • The MLS® Home Price Index (MLS® HPI) rose 0.9% month-over-month and was up 24.4% year-over-year.
  • The actual (not seasonally adjusted) national average sale price posted a 25.9% year-over-year gain in June.

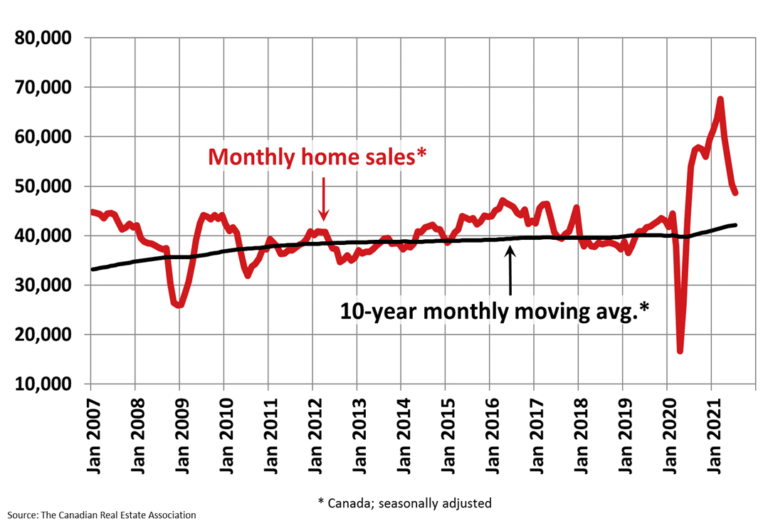
Home sales recorded over Canadian MLS® Systems fell by 8.4% month-over month in June 2021, marking the third straight monthly slowdown since activity hit an all-time record back in March. While sales are now down a cumulative 25% from their peak, and below every other month in the last year, June transactions still managed to set a record for that month. (Chart A)


Month-over-month declines in sales activity were once again quite broad-based, with sales moderating in around 80% of all local markets, including almost all large markets across Canada.


The actual (not seasonally adjusted) number of transactions in June 2021 was up 13.6% on a year-over-year basis and marked a new record for that month.


“While there is still a lot of activity in many housing markets across Canada, things have noticeably calmed down in the last few months,” said Cliff Stevenson, Chair of CREA. “There remains a shortage of supply in many parts of the country, but at least there isn’t the same level of competition among buyers we were seeing a few months ago. As these conditions continue to evolve over the summer and fall, your best bet is to consult with your local REALTOR® for information and guidance about buying or selling a home at this stage in the cycle,” continued Stevenson.


“It feels like maybe the theme of this summer is ‘slowly getting back to normal,’ in our own lives and for many housing markets across Canada as well,” said Shaun Cathcart, CREA’s Senior Economist. “That said, it’s a long road to get back to normal, and for many housing markets the main issue is that supply shortages are as acute as ever. At the same time, the break we’ve had on the population growth side of things is likely now coming to an end. So while the frenzy and emotion of earlier in the pandemic seem to have dissipated for now, the key ingredients of a seller’s market are all still in place. Housing has been a major election issue before and it will be this time around as well. The difference this time will likely be a focus on getting more housing built in the years ahead, so at least we’re finally having the right conversation.”


The number of newly listed homes edged back a slight 0.7% in June compared to May. In contrast to the past year’s synchronicity in demand and supply trends, the little-changed national new supply figure in June reflected a mixed bag of results, with about half of local markets seeing gains – welcome news for frustrated buyers.


The national sales-to-new listings ratio was 69.2% in June 2021, the lowest reading since last August. That said, the long-term average for the national sales-to-new listings ratio is 54.6%, so it remains historically high; although, it has been steadily moderating since peaking at 90.8% back in January.


Based on a comparison of sales-to-new listings ratio with long-term averages, more than half of all local markets were in balanced market territory in June, measured as being within one standard deviation of their long-term average. The was a significant shift compared to most of the past year which saw a majority of markets well into seller’s market territory.


The number of months of inventory is another important measure of the balance between sales and the supply of listings. It represents how long it would take to liquidate current inventories at the current rate of sales activity.


There were 2.3 months of inventory on a national basis at the end of June 2021, up from 2.1 months in May and up from an all-time record-low of just 1.8 months in March. That said, it is still very much in seller’s market territory. The long-term average for this measure is a little over 5 months.


The Aggregate Composite MLS® Home Price Index (MLS® HPI) rose 0.9% month-over-month in June 2021, continuing the trend of decelerating month-over-month growth that began in March. That deceleration was initially seen more so on the single-family side; although, that trend is now also playing out in the townhome and apartment segments.


The non-seasonally adjusted Aggregate Composite MLS® HPI was up 24.4% on a year-over-year basis in June. Based on data back to 2005, this was another record yearover-year increase; although, given how price growth took off in July of last year, this June 2021 reading may end up being the peak for year-over-year growth. (Chart B)


Looking across the country, year-over-year price growth is averaging around 20% in B.C., though it is lower in Vancouver and higher in other parts of the province. Yearover-year price gains in the 10% range were recorded in Alberta and Saskatchewan, while gains are closer to 15% in Manitoba. Ontario is seeing an average year-overyear rate of price growth in the 30% range, however, as with B.C., gains are notably lower in the GTA and considerably higher in most other parts of the province. The opposite is true in Quebec, where Montreal is in the 25% range and Quebec City is in the 15% range. Price growth is running a little above 30% in New Brunswick, while Newfoundland and Labrador is in the 10% range.


The MLS® HPI provides the best way to gauge price trends because averages are strongly distorted by changes in the mix of sales activity from one month to the next.


The actual (not seasonally adjusted) national average home price was a little over $679,000 in June 2021, up 25.9% from the same month last year. The national average price is also heavily influenced by sales in Greater Vancouver and the GTA, two of Canada’s most active and expensive housing markets. Excluding these two markets from calculations cuts more than $135,000 from the national average price.


Provided by: CREA

Read

Fantastic First Half of 2021
Despite many challenges, the first half of 2021 has been fantastic and I could not have done it without my amazing clients and referrals. Thank you so much and cannot wait to see what the 2nd half of the year will bring. Congrats to all the June Top 10 realtors!
Read

Housing Market Activity Normalizing After a Frenetic Year

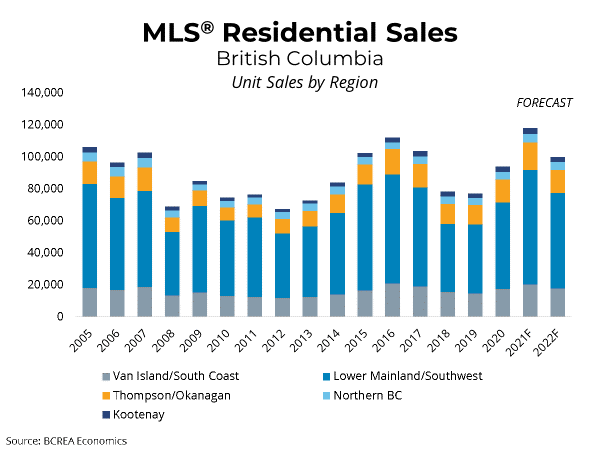
The British Columbia Real Estate Association (BCREA) reports that a total of 11,070 residential unit sales were recorded by the Multiple Listing Service® (MLS®) in June 2021, an increase of 34.7 per cent over June 2020. The average MLS® residential price in BC was $910,445, a 22.2 per cent increase from $745,194 recorded in June 2020. Total sales dollar volume was $10.1 billion, a 64.6 per cent increase from last year.


“As expected, housing market activity is calming to start the second half of 2021,” said BCREA Chief Economist Brendon Ogmundson. “That said, while down from record highs earlier this year, home sales across the province remain well above long-run average levels.”


Total active residential listings were down 23.4 per cent year-over-year in June and continued to fall on a monthly seasonally adjusted basis.


Year-to-date, BC residential sales dollar volume was up 161.6 per cent to $64.7 billion, compared with the same period in 2020. Residential unit sales were up 114.3 per cent to 70,690 units, while the average MLS® residential price was up 22.1 per cent to $915,563.


Click here for more...


Provided by: BCREA

Read

Metro Vancouver’s housing market sets a steady, calmer pace to begin the summer season

While still elevated, home sale and listing activity in Metro Vancouver* has eased back from the record-setting pace seen in March and April of this year.


The Real Estate Board of Greater Vancouver (REBGV) reports that residential home sales in the region totalled 3,762 in June 2021, a 54 per cent increase from the 2,443 sales recorded in June 2020, and an 11.9 per cent decrease from the 4,268 homes sold in May 2021.


Last month’s sales were 18.4 per cent above the 10-year June sales average.


“Metro Vancouver’s housing market continues to experience strong seller’s market conditions, although the intensity of demand has eased from what we saw throughout most of the spring,” Keith Stewart, REBGV economist said. “The past two months have shown a market that’s shifting toward more historically typical conditions.”


There were 5,849 detached, attached and apartment properties newly listed for sale on the Multiple Listing Service® (MLS®) in Metro Vancouver in June 2021. This represents a 1.1 per cent increase compared to the 5,787 homes listed in June 2020 and a 17.9 per cent decrease compared to May 2021 when 7,125 homes were listed.


The total number of homes currently listed for sale on the MLS® system in Metro Vancouver is 10,839, a 5.1 per cent decrease compared to June 2020 (11,424) and a 1.2 per cent decrease compared to May 2021 (10,970).


“With low interest rates, a growing economy and an improving job market, the Metro Vancouver housing market continues to enjoy solid economic fundamentals,” Stewart said. “We’re now seeing a market that’s beginning to normalize from the torrid pace in the spring. This is making multiple offers less common, allowing subjects to be seen on offers more frequently again, and is making new price records less likely.”


For all property types, the sales-to-active listings ratio for June 2021 is 34.7 per cent. By property type, the ratio is 27.5 per cent for detached homes, 49.2 per cent for townhomes, and 37.1 per cent for apartments.


Generally, analysts say downward pressure on home prices occurs when the ratio dips below 12 per cent for a sustained period, while home prices often experience upward pressure when it surpasses 20 per cent over several months.


The MLS® Home Price Index composite benchmark price for all residential properties in Metro Vancouver is currently $1,175,100. This represents a 14.5 per cent increase over June 2020 and a 0.2 per cent increase compared to May 2021.


Sales of detached homes in June 2021 reached 1,262, a 45.7 per cent increase from the 866 detached sales recorded in June 2020. The benchmark price for detached properties is $1,801,100. This represents a 22 per cent increase from June 2020 and is virtually unchanged from May 2021.


Sales of apartment homes reached 1,774 in June 2021, a 60.5 per cent increase compared to the 1,105 sales in June 2020. The benchmark price of an apartment is $737,600. This represents a 8.9 per cent increase from June 2020 and a 0.1 per cent increase compared to May 2021.


Attached home sales in June 2021 totalled 726, a 53.8 per cent increase compared to the 472 sales in June 2020. The benchmark price of an attached home is $946,900. This represents a 17.4 per cent increase from June 2020 and a 1.1 per cent increase compared to May 2021. 


Click here for more...


Provided by: REBGV

Read

Just Sold - 207 9288 University Cr., - Burnaby, Burnaby North, SFU


This property is located in a trendy area that is less than an 8-minute walk from Simon Fraser Universtiy. The unit is very bright, clean & quiet & boasts a wonderful view of Mount Baker, the Fraser River, the inlet & awe-inspiring sunrises. The property is beautifully landscaped & the building is very well maintained. Within walking distance there is Nester Market, other shopping, a local pup & spectacular nature filled walking trails that extend to and beyond Burnaby Mountain. This is perfect for an investment or makes for an affordable home for a first time buyer. Showing by appointment only!


Listing Offered by: Nu Strem Realty Inc.

Read

Just Sold: 24218 104 Ave., Maple Ridge, Albion

Perfect Family Home

4 Bed & Den, 4 Bath, 2706sqft

Priced at $948,800


Click here for more...


Immaculate home in desirable family-oriented neighborhood. Functional layout shows well AND located in popular c̓əsqənelə catchment. Search no further! This 4 bed+den/4bath/3lvl/ 2706sqft home sits on a 3068sqft South facing lot. Features: plenty of natural light, fresh paint, welcoming entrance, great room style main floor, gourmet kitchen w/plenty of cupboard & counter space, SS appls, den & access to covered porch; perfect for year-round entertaining. Up: huge master w/ensuite & oversized soaker & walk-in closet, 2 well-sized rooms, laundry & nook space. Benefit from the bright, partially above ground 1 bed in-law suite w/laundry & extra space for up-stairs living. Bonus: large dble car garage w/tons storage & A/C! Fantastic location close to all amenities. Call for showing details.

Read

Hafez is an absolute pleasure to work with! His deep knowledge of the industry, and vast experience working in UniverCity at SFU, made the process of buying and selling in a crazy market so much less stressful. He always made us feel like we were his top priority and ensured that all the details - big or small - were completely taken care of. This is our third time working with Hafez and we can't recommend him highly enough.


K. & P. R

Read

Just Sold: 28 9229 University Cr., Burnaby, Burnaby North, SFU

Serenity Garage Home

3 bed, 3 bath, 1403sqft

Updated Throughout

Priced at $824,800


Click here for more...


Rarely available and highly sought after. Looking for more space? Always wanted a garage? Your search ends here. This 3bed/3bath/3lvl/1403sqft home w/tandem garage is located in Serenity of UniverCity, Vancouver's premier lifestyle neighborhood. Main: open layout w/tons of light, separate living & dining rms, laminate floors, updated kitchen w/SS appls, quartz counters, breakfast bar, eating area, & 2pc bath. Enjoy the private, covered green space facing balcony. Up: master w/5pc ensuite, updated counters & loads of closet space. 2nd & 3rd rms, all new flooring & 4pc bath w/updated counters complete this lvl. Lower: welcoming entrance w/heated floors & tons of storage. Close to: transit, shopping, indoor/outdoor rec. & a host of UniverCity resident only perks. Call now for showing details.

Read

Housing market continues to moderate in May

Statistics released today by the Canadian Real Estate Association (CREA) show national home sales and new listings were both down between April and May 2021.


Summary:

  • National home sales declined by 7.4% on a month-over-month basis in May.
  • Actual (not seasonally adjusted) activity was up 103.6% year-over-year.
  • The number of newly listed properties fell back by 6.4% from April to May.
  • The MLS® Home Price Index (MLS® HPI) rose 1% month-over-month and was up 24.4% year-over-year.
  • The actual (not seasonally adjusted) national average sale price posted a 38.4% year-over-year gain in May.

Home sales recorded over Canadian MLS® Systems fell by 7.4% month-over month in May 2021, building on the 11% decline recorded in April. Activity nonetheless remains historically high, but in contrast to March’s all-time record it is now running closer to levels seen in the second half of 2020.


Month-over-month declines in sales activity were observed in close to 80% of all local markets. It was a mixed bag of results, with a slowdown in sales observed in most large markets across Canada.


With May 2021 activity setting a record for the month, and May 2020 sales marking the worst May since the late 1990s, the actual (not seasonally adjusted) number of transactions this year represented a 103.6% increase on a year-over-year basis.


“While housing markets across Canada remain very active, we now have two months of moderating activity in the books, and that goes for demand, supply and prices,” stated Cliff Stevenson, Chair of CREA. “More and more, there is anecdotal evidence of offer fatigue and frustration among buyers, and the urgency to lock down a place to ride out COVID would also be expected to fade at this point given where we are with the pandemic. As always, your best bet is to consult with your local REALTOR® for the best information and guidance about buying or selling a home in this rapidly changing market,” continued Stevenson.


“With the synchronous cooling off of demand, supply and prices in recent months, one could draw comparisons to last year’s initial lockdowns, but this year feels different,” said Shaun Cathcart, CREA’s Senior Economist. “Of course, the main difference this year is that the slowdown in the market was coincident not just with record COVID cases and fresh lockdowns but with the take up in the vaccination rate, so maybe we all finally have something else to think about other than housing and being stuck at home all the time. Going forward there is still a good probability of increased churn in resale markets as we get more certainty around our post-COVID lives and people move around more than they would have in a non-COVID world. But for now at least, with the light at the end of the tunnel so close, it feels like housing may take a back seat to us all starting to get our lives back to normal this summer.”


The number of newly listed homes declined by 6.4% in May compared to April. At a time where so many markets are struggling with historically low inventory, sales activity depends on a steady stream of new listings each month. As such, the concurrent gains in new supply and sales in March followed by synchronous declines in April and May suggest the slowdown in sales may not only be a demand story. New listings were down about 70% of all local markets in May.


The national sales-to-new listings ratio was 75.4% in May 2021, down slightly from 76.2% posted in April. The long-term average for the national sales-to-new listings ratio is 54.6%, so it remains historically high; although, it has been moderating since peaking at 90.7% back in January.


Based on a comparison of sales-to-new listings ratio with long-term averages, only about a quarter of all local markets were in balanced market territory in May, measured as being within one standard deviation of their longterm average. The other three-quarters of markets were above long-term norms, in many cases well above.


The number of months of inventory is another important measure of the balance between sales and the supply of listings. It represents how long it would take to liquidate current inventories at the current rate of sales activity.


There were 2.1 months of inventory on a national basis at the end of May 2021, up from a record-low 1.7 months in March but still well below the long-term average for this measure of over 5 months.


The Aggregate Composite MLS® Home Price Index (MLS® HPI) rose 1% month-over-month in May 2021 – a noticeable deceleration. Most of the recent deceleration in month-over-month price growth has come from the single-family space compared to the more affordable townhome and apartment segments.


The non-seasonally adjusted Aggregate Composite MLS® HPI was up 24.4% on a year-over-year basis in May. Based on data back to 2005, this was another record yearover-year increase; although, it is not likely to go much higher at this point.


While the largest year-over-year gains continue to be posted across Ontario, this is also where month-over-month price growth has been slowing the most. Meanwhile, price growth has continued to accelerate in some other parts of the country, thus serving to reduce the year-over-year growth disparity between Ontario and other provinces.


The MLS® HPI provides the best way to gauge price trends because averages are strongly distorted by changes in the mix of sales activity from one month to the next.


The actual (not seasonally adjusted) national average home price was a little over $688,000 in May 2021, up 38.4% from the same month last year. That said, it is important to remember that the national average price dropped last April and May during the initial lockdowns as the higher-end of every market was effectively shut down. That serves to stretch these year-over-year comparisons over and above what is actually happening to prices.


The national average price is also heavily influenced by sales in Greater Vancouver and the GTA, two of Canada’s most active and expensive housing markets. Excluding these two markets from calculations cuts close to $140,000 from the national average price.


Provided by: CREA

Read
Reciprocity Logo The data relating to real estate on this website comes in part from the MLS® Reciprocity program of either the Greater Vancouver REALTORS® (GVR), the Fraser Valley Real Estate Board (FVREB) or the Chilliwack and District Real Estate Board (CADREB). Real estate listings held by participating real estate firms are marked with the MLS® logo and detailed information about the listing includes the name of the listing agent. This representation is based in whole or part on data generated by either the GVR, the FVREB or the CADREB which assumes no responsibility for its accuracy. The materials contained on this page may not be reproduced without the express written consent of either the GVR, the FVREB or the CADREB.