RSS

Just Sold: 409 9329 University Cr., Burnaby, Burnaby North, SFU


One of the best 3 bdrm, 2 bath Penthouse in Polygon's Harmony. Vaulted ceiling in Living room with 11 ft, Features updated with Newer stainless steel appliances, Samsung washer & Dryer, Marble counter tops, Bathroom vanity & faucets, Master bathroom shower, cabinetry, Lighting and more. This corner end unit with plenty of windows for natural light and view. Easy access to the trail and greenbelt. Rarely available with TWO side by side parking and extra large storage locker in the same building. Amenities include Exercise centre, Recreation room, Bike Storage and Visitor parking. Just steps to shopping, restaurants and elementary school. Pets and rental friendly. Call today for your private showing.


Listing Offered by: Royal Pacific Riverside Realty Ltd.

Read

Just Listed: 478 Mundy St., Coquitlam, Central Coquitlam


Luxury living at its finest. Top to bottom, in/out no expense spared. This 8bed/10bath/3-car garage/7136sqft home sits on a 9600sqft West facing level lot w/lane access in desirable Central Coquitlam. Features: over height ceilings on every floor, Control4 automation, 10 zone radiant heat, AC, LoE 366 windows, 8 camera sec, Miele appliance package, spice kitchen, guest bed on main floor, 1 bed legal suite, nanny quarters, media room, built-in speakers throughout & much more. The stunning great room has 20' ceilings, floor to ceiling tile wall, 60" F/P & direct yard access. Enjoy summer nights on the covered deck complete w/infra red heaters & speakers. Indulge in an 800sqft master suite w/spa inspired ensuite, soaker tub & oversized shower. All this and a location that can't be beat!


Click here for more...

Read

Weakening housing market fundamentals and an increase in average overvaluation estimates in the second quarter of 2020 have led to Canada’s housing market retaining a moderate degree of vulnerability. This analysis is according to the Canada Mortgage and Housing Corporation (CMHC) Housing Market Assessment (HMA) released today.


Results are based on data as of the end of June 2020 (annual rental apartment vacancy rates are from October 2019) and market intelligence up to the end of August 2020. This national report provides the housing market assessment at the national level and detailed results for 15 Census Metropolitan Areas (CMAs).


The last HMA was released in February, shortly before the COVID-19 pandemic led to significant and rapid changes in the economy. Due to the swift evolution of the situation and unprecedented level of uncertainty, the HMA was suspended until relevant and timely data were available again.


To ensure timely information, the overvaluation framework in this edition relies on preliminary estimates of some fundamental drivers of the housing market in the second quarter of 2020. Final calculations and ratings for overvaluation will be presented in the next HMA as finalized data for these fundamental drivers becomes available. The attached backgrounder also provides additional information.


While the HMA framework still focuses on the same key factors in assessing the degree of housing market vulnerability (overheating, price acceleration, overvaluation and overbuilding), there exists a wider range of housing market vulnerabilities in the context of the COVID-19 crisis. The HMA nonetheless remains useful to keep the pulse of housing markets in Canada and to continue monitoring potential imbalances.


Highlights:

  • The COVID-19 pandemic has affected all regions of the country.
  • Prior to the second quarter of 2020, Vancouver and Toronto were experiencing a general unwinding of housing market imbalances.
  • Vancouver and Toronto saw an increase in observed house prices in the second quarter of 2020 despite the COVID-19 driven decline in their estimated fundamental house prices. This has led to an increase in average overvaluation estimates in both housing markets.
  • The Ottawa, Moncton, and Halifax housing markets are all now assessed at an overall moderate degree of vulnerability.
  • Ottawa, Montréal, Moncton, and Halifax entered the second quarter of 2020 with emerging imbalances in their respective housing markets.
  • Observed house prices in all four CMAs had been growing prior to the onset of COVID-19 and continued growing in the second quarter, despite the general weakness in housing market fundamentals.
  • This has led to the detection of moderate evidence of overvaluation in Moncton and Halifax while a sustained increase in the rate of house price growth has led to the signaling of price acceleration in Ottawa and Montréal.
  • The COVID-19 pandemic and downward pressure on oil prices further aggravated Edmonton and Calgary’s recent economic challenges.
  • House prices in these Prairie centres fell in the second quarter of 2020. The rate of decline is below what can be explained by housing market fundamentals alone. This has led to an increase in average overvaluation estimates in both housing markets between the first and second quarters of 2020.
  • Evidence of overbuilding that was first detected in 2015 is still present in both markets.


Comparisons between the February 2020 and September 2020 reports
 OverheatingPrice AccelerationOvervaluation*OverbuildingOverall Assessment
  Feb. 2020Sept. 2020Feb. 2020Sept. 2020Feb. 2020Sept. 2020Feb. 2020Sept. 2020Feb. 2020Sept. 2020
Canada Low Low Low Low Moderate Moderate Low Low Moderate Moderate
Victoria Low Low Moderate Low Moderate Moderate Low Low High Moderate
Vancouver Low Low Low Low Moderate Low Low Low Moderate Moderate
Edmonton Low Low Low Low Low Low Moderate Moderate Low Low
Calgary Low Low Low Low Low Low Moderate Moderate Low Low
Saskatoon Low Low Low Low Low Low Low Low Low Low
Regina Low Low Low Low Low Low High Moderate Moderate Low
Winnipeg Low Low Low Low Low Low Moderate Moderate Low Low
Hamilton Moderate Moderate Moderate Low Low Low Low Low Moderate Moderate
Toronto Moderate Low Moderate Low Low Low Low Low Moderate Moderate
Ottawa Low Moderate Low Moderate Low Low Low Low Low Moderate
Montréal Moderate Moderate Low Moderate Low Low Low Low Low Low
Québec Low Moderate Low Low Low Low Low Low Low Low
Moncton Moderate Moderate Low Low Low Moderate Low Low Low Moderate
Halifax Low Low Low Low Low Moderate Low Low Low Moderate
St. John’s Low Low Low Low Low Low Moderate Low Low Low
Degree of vulnerability
  Low   Moderate   High

*The September 2020 overvaluation ratings are based on prliminary stimates.


CMHC issues the HMA on a quarterly basis to provide Canadians with expert and impartial insight and analysis, based on the best data available in Canada. The report provides a comprehensive view of housing market vulnerabilities and identifies imbalances. The HMA is not intended to identify long-term challenges related to housing affordability.


Provided by: CMHC

Read

BC Housing Markets Heat Up as Summer Ends


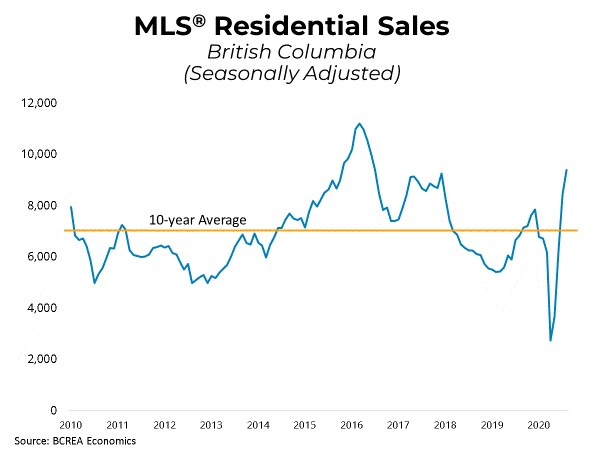
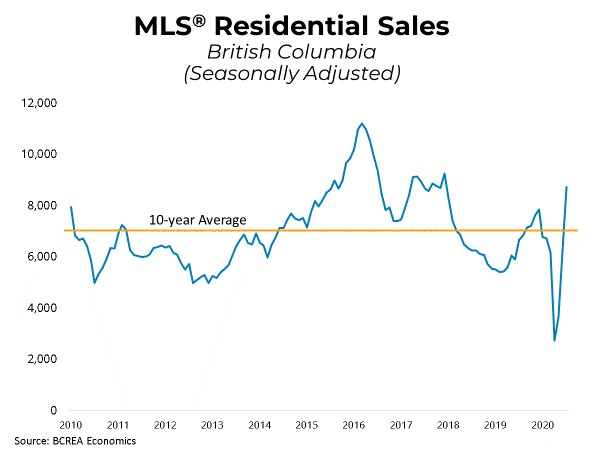
The British Columbia Real Estate Association (BCREA) reports that a total of 10,172 residential unit sales were recorded by the Multiple Listing Service® (MLS®) in August 2020, an increase of 42.8 per cent from August 2019. The average MLS® residential price in BC was $771,309, a 12.7 per cent increase from $684,093 recorded the previous year. Total sales dollar volume in August was $7.8 billion, a 61.1 per cent increase over 2019.


“Very strong provincial home sales continued in August,” said BCREA Chief Economist Brendon Ogmundson. “While pentup demand from the spring is driving much of the increase, we anticipate a sustained strong level of sales through the fall.”


Total provincial active listings are still down more than 10 per cent year-over-year, with some markets even more under-supplied as the pandemic continues to keep listings low. As a result, prices are sharply rising around the province.


Year-to-date, BC residential sales dollar volume was up 15.8 per cent to $40.4 billion, compared with the same period in 2019. Residential unit sales were up 4.9 per cent to 53,336 units, while the average MLS® residential price was up 10.4 per cent to $757,504. -


Click here for more...


Provided  by: BCREA

Read

NEW PRICE: 312 501 Cochrane Ave., Coquitlam, Coquitlam West

2 Level Home with 3 Bedrooms

Bright & Open

Location Can’t be Beat

NEW PRICE: $668,000


SMOKING DEAL ALERT! Aggressively priced! "KILLER" location! Fantastic layout! Oh, and ripe for re-development! Have we got your attention yet? Your search ends here. This bright, South/East exposure, top floor, 3bed/2bath/2level/1495sqft home offers stunning vaulted ceilings, engineered flooring throughout, open living/dining rooms, tons of in suite storage, electric F/P & a fully remodeled kitchen w/hi-end SS appliances, granite counters, breakfast bar & island. The spacious master has pass through closest & 3-piece ensuite, the 2nd bedroom is well sized & the 3rd bed is in the loft. Bonus: flex space, 2 parking & locker. Located in the heart of Burnaby/Coquitlam boarder, stone’s throw to: transit, Skytrain, shopping, recreation, schools and every amenity you can think of. Act Now!


Click here to see more...

Read

Just Listed: 110 160 Shoreline Circle, Port Moody, College Park

Looking for outdoor space? A place that feels more like a house then condo? Look no further, your search ends here! This 1258sqft/2bed & den/2bath/2level move-in ready home offers an open layout & excellent room separation. Features: laminate floors, SS apps, tons cupboard & counter space, in-suite storage, well-sized den, an abundance of light & 191sqft of deck space; perfect for entertaining. Updates: powder coated railings, plumbing fixtures & counters in kitchen & bathrooms & brand new HW tank. The spacious master has room for king size bed, pass through closets & a 4pc ensuite. The 2nd bed is well size w/good closet space.  Bonus: 2 parking, locker & rental & pet friendly. Centrally located to: schools, parks, Rocky Point, Skytrain, Brewers Row & all sorts of amenities. Act Now!


Click here for more...


Read

Home sale and listing activity continues to increase in August

Home buyers and sellers remained active across Metro Vancouver* in August, with home sale and new listing activity outpacing the region’s historical averages.


The Real Estate Board of Greater Vancouver (REBGV) reports that residential home sales in the region totalled 3,047 in August 2020, a 36.6 per cent increase from the 2,231 sales recorded in August 2019, and a 2.6 per cent decrease from the 3,128 homes sold in July 2020.


Last month’s sales were 19.9 per cent above the 10-year August sales average.


“People who put their home buying and selling plans on hold in the spring have been returning to the market throughout the summer,” Colette Gerber, REBGV Chair said. “Like everything else in our lives these days, the uncertainty COVID-19 presents makes it challenging to predict what will happen this fall.”


There were 5,813 detached, attached and apartment properties newly listed for sale on the Multiple Listing Service® (MLS®) in Metro Vancouver in August 2020. This represents a 55.1 per cent increase compared to the 3,747 homes listed in August 2019 and a 2.3 per cent decrease compared to July 2020 when 5,948 homes were listed.


This was 34.8 per cent above the 10-year August new listings average.


The total number of homes currently listed for sale on the MLS® system in Metro Vancouver is 12,803, a 4.4 per cent decrease compared to August 2019 (13,396) and a six per cent increase compared to July 2020 (12,083).


For all property types, the sales-to-active listings ratio for August 2020 is 23.8 per cent. By property type, the ratio is 23.7 per cent for detached homes, 30.5 per cent for townhomes, and 21.6 per cent for apartments.


Generally, analysts say downward pressure on home prices occurs when the ratio dips below 12 per cent for a sustained period, while home prices often experience upward pressure when it surpasses 20 per cent over several months.


“Low interest rates and limited overall supply of homes for sale are creating competition in today’s housing market,” Gerber said. “Your local REALTOR® can help you navigate today’s market and ensure that the latest public health requirements are followed at every step of the process. Above all, safety has to remain our top priority during this pandemic.”


The MLS® Home Price Index composite benchmark price for all residential properties in Metro Vancouver is currently $1,038,700. This represents a 5.3 per cent increase over August 2019 and a 0.7 per cent increase compared to July 2020.


Sales of detached homes in August 2020 reached 1,095, a 55.1 per cent increase from the 706 detached sales recorded in August 2019. The benchmark price of a detached home is $1,491,300. This represents a 6.6 per cent increase from August 2019 and a one per cent increase compared to July 2020.


Sales of apartment homes reached 1,332 in August 2020, a 19.4 per cent increase compared to the 1,116 sales in August 2019. The benchmark price of an apartment property is $685,800. This represents a 4.5 per cent increase from August 2019 and a 0.5 per cent increase compared to July 2020.


Attached home sales in August 2020 totalled 620, a 51.6 per cent increase compared to the 409 sales in August 2019. The benchmark price of an attached home is $806,400. This represents a 4.4 per cent increase from August 2019 and a 1.1 per cent increase compared to July 2020.


Click here for more...


Provided by: REBGV

Read

Surprisingly Strong Recovery to Propel Housing Market in 2021

BCREA 2020 Third Quarter Housing Forecast Update


The recession prompted by COVID-19 is on pace to be one of the worst on record for the BC economy. However, looking at recent data in the housing market, it would be difficult to tell there was a recession at all. While home sales initially fell to historic lows in April, sales have recently soared, more than regaining pre-pandemic levels. Consequently, the outlook for the housing market is much brighter following a stronger than expected summer.


The explanation for the counter-intuitive performance of the housing market lies in the very unusual characteristics of the COVID-19 recession. Unlike in a typical recession, many of the job losses have been felt in lower-wage, frontline service sector jobs, typically held by younger workers. Meanwhile, higher-wage sectors that tend to drive the ownership market have seen employment levels fully recover. As a result, sales activity has spiked as record-low mortgage rates unleashed a wave of pent-up demand previously sidelined by the pandemic.


Moreover, while a recession typically means a buildup of inventory as job losses and falling incomes force households to sell, social distancing measures, mortgage deferrals and sellers’ reluctance to move during the pandemic caused the supply of re-sale listings to decline through the spring.


The combination of strong home sales and an undersupplied market, along with a desire for more space on the part of buyers, has meant that many markets are now seeing sharply rising average prices despite a weak provincial economy.


While significant uncertainty remains, including the end or transition of key government supports and a concerning rise in COVID-19 cases, the unexpectedly swift rebound in the market means that BC home sales will almost certainly finish 2020 higher than 2019. We are forecasting total sales of 82,380 this year, before rising to 96,860 in 2021, as a recovering economy and low mortgage rates continue to drive demand. The average home price is forecast to rise 7.7 per cent this year and 3.7 per cent in 2021.


Click here for more...


Provided by: BCREA

“Copyright British Columbia Real Estate Association. Reprinted with permission.”

Read

Just Sold: 50 19034 McMyn Road., Pitt Meadows, Mid Meadows


LOCATION, LOCATION, LOCATION Beautiful South facing end, this 3bed,3 bath has been tastefully updated and features a spacious floor plan complimented with plenty of windows and an abundance of natural light. There is a large kitchen complete with updated S.S Appliances as well as a spacious dining room for all of the family and friends gatherings. The nicely appointed lower level Living room with loft height also provides a natural gas fireplace and the perfect place to unwind. Upstairs includes 3 bedrooms including a master bedroom with loads of room along with newly updated ensuite. Up also offers 2 more functional bedrooms. Plenty of storage, parking, and outdoor spaces to enjoy. RV PARKING, Short walk to W.C express, and only steps to Restaurants, Save on and parks.


Listing Offered by: Royal LePage Brookside Realty

Read

Just Listed: C322 20211 66th Ave., Langley, Willoughby Heights

Excellent Central Location

Rental and Pet Friendly

Price at $474,800


Click here for more...


Bright, open and functional are just a few ways to describe this fantastic unit. Located in the popular Elements building in the desirable Willoughby Heights neighborhood of Langley, with a location that can't be beat. Welcome home! Features: modern finishing, over height ceilings, spacious layout, laminate floors through & newer carpets in the bedrooms, a spacious kitchen w/plenty cupboard & granite counters space & SS apps, laundry closet w/extra storage & an excellent sized balcony perfect for BBQs. The large master has pass through closets & 3 pc spa inspired ensuite while the 2nd bed is well sized. Bonus: 1 parking, locker on your floor & rental and pet friendly. Located close to shopping, recreation, transit, schools, parks and more. Act Now!

Read

Canadian housing markets set multiple records in July 2020

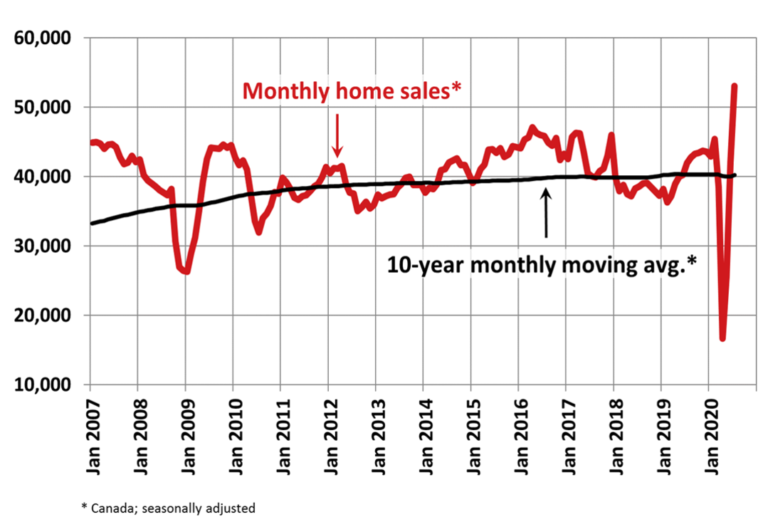
Statistics released today by the Canadian Real Estate Association (CREA) show national home sales and new listings continued to rebound in July 2020, with new listings hitting their highest level on record for the month of July, while sales posted the highest level of any month in history.


Summary:

  • National home sales rose 26% on a month-over-month (m-o-m) basis in July.
  • Actual (not seasonally adjusted) activity was up 30.5% year-over-year (y-o-y).
  • The number of newly listed properties climbed 7.6% from June to July.
  • The MLS® Home Price Index (HPI) rose 2.3% m-o-m and was up 7.4% y-o-y.
  • The actual (not seasonally adjusted) national average sale price posted a 14.3% y-o-y gain.

Home sales recorded over Canadian MLS® Systems rebounded by a further 26% in July 2020, raising them to the highest monthly level ever recorded.


For the third month in a row, transactions were up on a m-o-m basis across the country. Among Canada’s largest markets, sales rose by 49.5% in the Greater Toronto Area (GTA), 43.9% in Greater Vancouver, 39.1% in Montreal, 36.6% in the Fraser Valley, 31.8% in Hamilton-Burlington, 28.7% in Ottawa, 16.9% in London and St. Thomas, 15.7% in Calgary, 12.1% in Winnipeg, 9.7% in Edmonton and 5.4% in Quebec City.


Actual (not seasonally adjusted) sales activity posted a 30.5% y-o-y gain in July. The 62,355 transactions recorded in July 2020 marked the highest monthly sales figure on record going back more than 40 years.


“With more and more of regular everyday life opening back up, REALTORS® and their clients across Canada are making up for lost time, and it’s been a very busy summer as a result,” stated Costa Poulopoulos, Chair of CREA. “With sellers and buyers returning to the market in record numbers as lockdowns are increasingly lifted, we continue to make sure clients stay safe by complying with government and health officials’ directives and advice, while continuing to use virtual technology to show properties and complete required forms and contracts. Now more importantly than ever, REALTORS® remain the best source for information and guidance when negotiating the sale or purchase of a home,” continued Poulopoulos.


“What a difference three months makes, from some of the lowest housing numbers ever back in April to the multiple monthly records logged in July,” said Shaun Cathcart, CREA’s Senior Economist. “A big part of what we’re seeing right now is the snap back in activity that would have otherwise happened earlier this year. Recall that before the lockdowns, we were heading into the tightest spring market in almost 20 years. Things may have gone quiet for a few months, but ultimately the market we’re seeing right now is mostly the same one we were heading into back in March. That said, there are some new factors at play as well. There are listings that will come to the market because of COVID-19, but many properties are also not being listed right now due to the virus, as evidenced by inventories that are currently at a 16-year low. Some purchases will no doubt be delayed, but the new-found importance of home, lack of a daily commute for many, a desire for more outdoor and personal space, room for a home office, etc. will certainly also spur activity that otherwise would not have happened in a non-COVID-19 world.”


The number of newly listed homes climbed by another 7.6% in July compared to June. New supply was only up in about 60% of local markets, as the rebound in supply appears to be tapering off in many parts of the country. The national increase in July was dominated by gains in the GTA.


With the ongoing rebound in sales activity now far outpacing the recovery in new supply, the national sales-to-new listings ratio tightened to 73.9% in July compared to 63.1% posted in June. It was one of the highest levels on record for this measure, behind just a few months back in late 2001 and early 2002.


Based on a comparison of sales-to-new listings ratios with long-term averages, only about a third of all local markets were in balanced market territory, measured as being within one standard deviation of their long-term average, in July 2020. The other two-thirds of markets were all above long-term norms, in many cases well above.


The number of months of inventory is another important measure of the balance between sales and the supply of listings. It represents how long it would take to liquidate current inventories at the current rate of sales activity.

There were just 2.8 months of inventory on a national basis at the end of July 2020 – the lowest reading on record for this measure. At the local market level, a number of Ontario markets shifted from months of inventory to weeks of inventory in July.


The Aggregate Composite MLS® Home Price Index (MLS® HPI) jumped by 2.3% m-o-m in July 2020 – the second largest increase on record (after March 2017) going back 15 years.


Of the 20 markets currently tracked by the index, every one posted a m-o-m increase in July.


The biggest m-o-m gains, in the range of 3%, were recorded in the GTA, Guelph, Ottawa and Montreal; although, generally speaking most markets east of Saskatchewan are seeing prices accelerate in line with strong sales numbers. Price gains were more modestly positive in B.C. and Alberta.


The non-seasonally adjusted Aggregate Composite MLS® HPI was up 7.4% on a y-o-y basis in July – the biggest gain since late 2017.


The MLS® HPI provides the best way to gauge price trends because averages are strongly distorted by changes in the mix of sales activity from one month to the next.


The actual (not seasonally adjusted) national average price for homes sold in July 2020 was a record $571,500, up 14.3% from the same month last year.


The national average price is heavily influenced by sales in the Greater Vancouver and the GTA, two of Canada’s most active and expensive housing markets. Excluding these two markets from calculations cuts around $117,000 from the national average price. The extent to which sales continue to fluctuate in these two markets relative to others could have further compositional effects on the national average price, both up and down.


Provided by: CREA

Read

Strong Recovery Continues for BC Housing Markets


The British Columbia Real Estate Association (BCREA) reports that a total of 10,090 residential unit sales were recorded by the Multiple Listing Service® (MLS®) in July 2020, an increase of 26.6 per cent from July 2019. The average MLS® residential price in BC was $770,810, a 12.9 per cent increase from $682,702 recorded the previous year. Total sales dollar volume in July was $7.8 billion, a 43 per cent increase over 2019.


“The strong recovery in sales activity continued in July,” said BCREA Chief Economist Brendon Ogmundson. “Increased demand for more living space combined with an undersupplied market is producing significant upward pressure on home prices, particularly in the market for single-family homes.”


Active listings remain down significantly year-over-year, creating upward pressure on prices, though increased demand for single-family homes has somewhat skewed average prices in some markets.


Year-to-date, BC residential sales dollar volume was up 8.4 per cent to $32.5 billion, compared with the same period in 2019. Residential unit sales were down 1.4 per cent to 43,718 units, while the average MLS® residential price was up 10 per cent to $754,842.


Click here for more....


Provided by: BCREA

Read
Reciprocity Logo The data relating to real estate on this website comes in part from the MLS® Reciprocity program of either the Greater Vancouver REALTORS® (GVR), the Fraser Valley Real Estate Board (FVREB) or the Chilliwack and District Real Estate Board (CADREB). Real estate listings held by participating real estate firms are marked with the MLS® logo and detailed information about the listing includes the name of the listing agent. This representation is based in whole or part on data generated by either the GVR, the FVREB or the CADREB which assumes no responsibility for its accuracy. The materials contained on this page may not be reproduced without the express written consent of either the GVR, the FVREB or the CADREB.