RSS

Just Listed: 1611 Manning Ave., Port Coquitlam, Birchland Manor


Excellent potential opportunity to build a single family home with coach house. Rezoning under way with the City. Currently zoned RD (duplex) with proposal already under review to rezone to RS4. 3rd Reading at the City has been issued. Desirable central location, close to transit, shops, Lougheed Hwy, schools and much more. Features: 35'8122', 4021sqft level lot with lane access and already cleared. Act Now!


Click here for more...

Read

Just Listed: 1607 Manning Ave.,Port Coquitlam, Birchland Manor


Development Permit issued! Plans available. Excellent opportunity for all builders or someone looking to build a custom 1/2 duplex. Desirable central location, close to transit, shops, Lougheed Hwy, schools and much more. Features: 45' * 122', 5410sqft level corner lot with lane access and already cleared. Zoned for approximately 4300sqft 2 storey w/basement duplex (approximately 2150sqft per side) with detached garage. Act now!


Click here for more...

Read

Real Estate On Tap


Curious about the Real Estate market in Vancouver? Want to learn more about the basics of how to "get in the market"? Find out the potential investment returns real estate can offer for free! Join us for a casual evening of drinks, appetizers & door prizes, on us! June 25th at Twin Sails Brewing Port Moody BC. Meet like minded peers and industry professionals that can answer your questions.


Secure your ticket here: 

https://www.eventbrite.ca/e/real-estate-on-tap-tickets-61711360340?utm-medium=discovery&utm-campaign=social&utm-content=attendeeshare&aff=esfb&utm-source=fb&utm-term=listing


Presented by: Hafez Panju of Royal LePage, Aaron Lochhead of CIBC, Mike Mollica of MGM Financial, and Michael LeBeau of LeBeau Law Corporation.


Read

 Downturn in Metro Vancouver market means billions in paper losses for homeowners: report


It's difficult to tell what part of the $89 billion in real estate market equity losses in Metro Vancouver are due to government policies rather than changing market forces.


The downturn in the Metro Vancouver real estate market has resulted in an estimated paper loss of $89.2 billion for property owners in the past year, according to a new analysis.


The study used assessed values reported in January to estimate the total value of residential properties after the decline in median home prices for all housing types in Metro Vancouver between April 2018 and April 2019.


From this, it estimated the average loss in total equity value and the estimated average equity loss per household in each area.


Vancouver, which has the highest number of dwellings at 283,915 dwellings, had a 13 per cent drop in total equity value, a loss of $43.6 billion or $153,873 per household.

West Vancouver has fewer homes at 16,930, but it had the highest percentage decrease in median value at 14.7 per cent. This is a drop of $7.6 billion in total equity value, or $451,485 per household.

• In Port Coquitlam, where there are 21,755 homes, there was a 10.2 per cent decrease, a drop of $1.5 billion in total equity value or $71,634 per household.


Paul Sullivan, senior partner at Burgess, Cawley Sullivan & Associates, a Vancouver-based commercial real estate and property tax appraisal firm, presents the findings today.


He mainly pins blame on B.C.’s demand-side taxes, including the speculation and vacancy tax, the additional school tax on luxury properties and increase in the foreign-buyers tax, arguing, in an opinion piece published by Postmedia, that “something has to give” as homeowners are faced with rising taxes and falling equity.


The period examined by Sullivan captures the implementing of federal mortgage stress testing rules in January 2018 and the announcing of the provincial housing taxes in February 2018. These ushered in a more significant slowdown in the number of home sales and then in prices.


At the same time, other markets such as Hong Kong, Singapore, Sydney, London and New York, which had double-digit percentage gains in recent years that were comparable to the Vancouver area, also started to soften in 2018 as overseas investment from China retreated because of stricter capital controls from Beijing and because financing became harder and more expensive to obtain.


In B.C., there has also been growing scrutiny of the nature of funds flowing into the once hot real estate market.


Sullivan said in an email it would difficult to calculate what part of the equity losses are caused by various government policies and how much by other changing market forces.


He wrote in the opinion piece that the losses are not necessarily only paper ones.


“Equity can be pulled out of your home to pay for things like unexpected emergency expenses, home renovations, post-secondary education and senior care costs.”


He added that this kind of equity loss can affect other parts of the economy as homeowners tighten their budgets.

The Bank of Canada recently said in its 2019 Financial System review that households in B.C. are more indebted, as measured by having a debt-to-income ratio greater than 350 per cent, and more of their net worth is concentrated in housing than in other provinces, with Ontario being at about 42 per cent of households and B.C. at about 52 per cent.


It went back to 2015 in describing how “when house prices grow at a faster pace than can be explained by economic fundamentals, a price correction that leads to financial stress becomes more likely. This can be serious when buyers are highly indebted,.”


The numbers in the report presented by Sullivan take into consideration the number of all dwellings in a municipality, including ones that are rental households.


Other distortions come from using an average of the percentage change in average sale prices for all housing types in a municipality. In Burnaby, for example, detached homes dropped in price by 13 per cent compared to attached homes dropping only one per cent and apartments by 4.42 per cent. The average percentage drop of all these housing types, 6.14 per cent, was used to estimate the equity loss of $5.25 billion for the municipality and $56,998 per household.


The NDP government has said its various taxes and measures are part of a wide plan intended to temper home prices and stabilize an overheated housing market that had become unaffordable for too many who make local incomes. It openly aims to charge speculators and those who pay income taxes in other jurisdictions a premium for buying homes.


Provided by: JOANNE LEE-YOUNG for the Vancouver Sun


Read

Just Sold: 1116 Hammond Ave., Coquitlam, Maillardville


ONE-OF-A-KIND view property in Central Location, special PRE-SALE opportunity offers the perfect balance of timeless design, contemporary charm, and functionality spread over nearly 4,800sf of luxury living featuring custom interior design, custom millwork/cabinetry, Italian tile & stone, radiant in-floor heat + A/C, full spice kitchen, home theatre system and more! Main floor offers EXPANSIVE open kitchen/living/dining areas including 10' island, with high-end appliances, family room leads into large deck with Fraser River views. Upstairs offers 4 beds & 3 baths and a WALK-OUT BASEMENT with additional living and 3 beds & 2 baths. 1 BED COACH HOUSE in rear. Expected completion April 2019.


Listing Offered by: Royal LePage West R.E.S.
Read

Canadian home sales rise in April 2019


Statistics released today by the Canadian Real Estate Association (CREA) show national home sales climbed in April 2019.


Highlights:

  • National home sales improved by 3.6% month-over-month (m-o-m) in April.
  • Actual (not seasonally adjusted) activity was up 4.2% year-over-year (y-o-y).
  • The number of newly listed homes climbed 2.7% m-o-m.
  • The MLS® Home Price Index (HPI) eased by 0.3% y-o-y in April.
  • The national average sale price edged up 0.3% y-o-y.

Home sales recorded via Canadian MLS® Systems rose by 3.6% m-o-m in April 2019. After having dropped in February to the lowest level since 2012, the rebound in sales over the past two months still leaves activity slightly below readings posted over most of the second half of 2018. (Chart A)


April sales were up in about 60% of all local markets, with the Greater Toronto Area (GTA) accounting for over half of the national gain.


Actual (not seasonally adjusted) sales activity was up 4.2% y-o-y in April (albeit from a seven-year low for the month in 2018), the first y-o-y gain since December 2017 and the largest in more than two years. The increase reflects gains in the GTA and Montreal that outweighed declines in the B.C. Lower Mainland.


“Housing market trends are improving in some places and not so much in others,” said Jason Stephen, CREA’s President. “All real estate is local. No matter where you are, a professional REALTOR® is your best source for information and guidance in negotiations to purchase or sell a home during these changing times,” said Stephen.

“Sales activity is stabilizing among Canada’s five most active urban housing markets,” said Gregory Klump, CREA’s Chief Economist. “That list no longer includes Greater Vancouver, which fell out of the top-five list for the first time since the recession and is well into buyers’ market territory. Sales there are still trending lower as buyers adjust to a cocktail of housing affordability challenges, reduced access to financing due to the mortgage stress-test and housing policy changes implemented by British Columbia’s provincial government,” said Klump.


The number of newly listed homes rose 2.7% in April, building on March’s 3.4% increase. New supply rose in about 60% of all local markets, led by the GTA and Ottawa.


With sales up by more than new listings in April, the national sales-to-new listings ratio tightened marginally to 54.8% from 54.3% in March. This measure of market balance has remained close to its long-term average of 53.5% since early 2018.


Considering the degree and duration to which market balance readings are above or below their long-term averages is the best way of gauging whether local housing market conditions favour buyers or sellers. Market balance measures that are within one standard deviation of their long-term average are generally consistent with balanced market conditions.


Based on a comparison of the sales-to-new listings ratio with the long-term average, about three-quarters of all local markets were in balanced market territory in April 2019.


The number of months of inventory is another important measure of the balance between sales and the supply of listings. It represents how long it would take to liquidate current inventories at the current rate of sales activity.


There were 5.3 months of inventory on a national basis at the end of April 2019, down from 5.6 and 5.5 months in February and March respectively and in line with the long-term average for this measure.


Housing market balance varies significantly by region. The number of months of inventory has swollen far beyond long-term averages in Prairie provinces and Newfoundland & Labrador, giving homebuyers there ample choice. By contrast, the measure remains well below long-term averages in Ontario and Maritime provinces, resulting in increased competition among buyers for listings and fertile ground for price gains.


The Aggregate Composite MLS® Home Price Index (MLS® HPI) appears to be stabilizing, having edged lower by 0.3% y-o-y in April 2019. (Chart B)


Among benchmark property categories tracked by the index, apartment units were again the only one to post a y-o-y price gain in April 2019 (0.5%), while two-storey single-family home and townhouse/row unit prices were little changed from April 2018 (-0.3% and -0.2%, respectively). By comparison, one-storey single-family home prices were down by -1.4% y-o-y.


Trends continue to vary widely among the 18 housing markets tracked by the MLS® HPI. Results remain mixed in British Columbia, with prices down on a y-o-y basis in Greater Vancouver (GVA; -8.5%) and the Fraser Valley (-4.6%), up slightly in the Okanagan Valley (1%) and Victoria (0.7%), while climbing 6.2% elsewhere on Vancouver Island.


Among Greater Golden Horseshoe housing markets tracked by the index, MLS® HPI benchmark home prices were up from year-ago levels in the Niagara Region (6.2%), Guelph (5.1%), Hamilton-Burlington (4.6%) the GTA (3.2%) and Oakville-Milton (2.5%). By contrast, home prices in Barrie and District held below year-ago levels (-5.3%).


Across the Prairies, supply remains historically elevated relative to sales and home prices remain below year-ago levels. Benchmark prices were down by 4.6% in Calgary, 4% in Edmonton, 4.3% in Regina and 1.7% in Saskatoon. The home pricing environment will likely remain weak in these cities until demand and supply return to better balance.


Home prices rose 7.8% y-o-y in Ottawa (led by an 11% increase intownhouse/row unit prices), 6.3% in Greater Montreal (led by a 7.8% increase in apartment unit prices), and 1.8% in Greater Moncton (led by an 11.5% increase in apartment unit prices). (Table 1)


The MLS® HPI provides the best way to gauge price trends, as averages are strongly distorted by changes in the mix of sales activity from one month to the next.


The actual (not seasonally adjusted) national average price for homes sold in April 2019 was close to $495,000, up 0.3% from the same month in 2018.


The national average price is heavily skewed by sales in the GVA and GTA, two of Canada’s most expensive housing markets. Excluding these two markets from calculations cuts almost $104,000 from the national average price, trimming it to just over $391,000.


Provided by: CREA

Read

Affordability Continues to Weigh on Housing Demand

The British Columbia Real Estate Association (BCREA) reports that a total of 6,652 residential unit sales were recorded by the Multiple Listing Service® (MLS®) in April, a decline of 18.9 per cent from the same month last year. The average MLS® residential price in the province was $685,304, a decline of 6.2 per cent from April 2018. Total sales dollar volume was $4.6 billion, a 23.9 per cent decline from the same month last year.


“BC home sales were essentially unchanged from March on a seasonally adjusted basis,” said BCREA Chief Economist Cameron Muir. “Prospective home buyers continue to grapple with the decline in their purchasing power caused by federal government changes to mortgage policy.”


Total MLS® residential active listings increased 33.6 per cent to 38,672 units compared to the same month last year. The ratio of sales to active residential listings declined from 28.4 per cent to 17.2 per cent over the same period.


Year-to-date, BC residential sales dollar volume was down 29.8 per cent to $13.9 billion, compared with the same period in 2018. Residential unit sales decreased 24.5 per cent to 20,479 units, while the average MLS® residential price was down 7 per cent to $680,671.


click here for more...


Provided by: BCREA

Read

Just Sold: 307 3051 Airey Dr., Richmond, West Cambie


Top floor, huge wrap around balcony; 2 large bedrooms, 2 full bathrooms and easy access to all of Richmond, Vancouver, Oak and Knight Street Bridges, the airport, Skytrain, Costco; Roof done 2011, and two parking and one storage; needs TLC. Call today for your private viewing!


Listing offered by: Magsen Realty Inc...

Read

$5 billion laundered through B.C. real estate in 2018


An independent report has found that $5 billion was laundered through British Columbia's real estate market last year and increased the cost of buying a home by five per cent.


The report by former B.C. deputy attorney general Maureen Maloney estimated that $7.4 billion overall was laundered in B.C. in 2018, a figure she says is conservative and added the total amount across Canada was about $47 billion.


Attorney General David Eby told a news conference on Thursday that money laundering is a ``malignant cancer'' on society and a ``national-level crisis.''


The provincial government commissioned two reports last September to shed light on money laundering by organized crime in the province's expensive real estate market.


Former deputy RCMP commissioner Peter German says in his report that the infusion of illicit money into the B.C. economy led to a frenzy of buying that raised the assessed values of homes throughout much of Metro Vancouver.

German's report says there are thousands of specific properties worth billions at high risk for potential money laundering.


An international anti-money laundering agency said last year that organized criminals were laundering about $1 billion annually in the province.


But Maloney's report details far more cash was filtered.


"As a conservative estimate, we're looking at money laundering on the scale of $7.4 billion in 2018. That's just for B.C., let alone the rest of Canada,'' she said.


Eby said wealthy criminals and those trying to evade taxes have run out of the province for too long, to the point they're distorting the economy, hurting families looking for housing and impacting those who have lost loved once because of the opioid overdose crisis.


"I am under no illusions that the problems we face are unique to B.C.,'' said Eby.


Federal Organized Crime Reduction Minister Bill Blair said earlier that he and Eby have met several times this year and are working together to fight money laundering.


The reviews aimed to shed light on money laundering by organized crime in real estate after last June's report on dirty money in casinos by German.


Following the gaming report, German was appointed to conduct a second review to focus on identifying the scale and scope of illicit activity in the real estate market.


Eby said earlier this week he was shocked to hear some criminals laundering money through B.C.'s luxury car sector are getting provincial sales tax rebates.


The attorney general said the government will move to plug tax loopholes to prevent the vehicle tax rebate that cost the province almost $85-million dollars since 2013.


B.C. also tabled legislation aimed at preventing tax evasion and money laundering by shining a spotlight on anonymous real estate owners hiding behind shell and numbered companies.


Several regulatory and professional agencies anticipated the findings of the reports and put anti-money-laundering policies in place last month.


The B.C. Real Estate Council said it would be partnering with the federal Financial Transactions and Reports Analysis Centre of Canada, or FINTRAC, to identify and deter money laundering and terrorist financing in the industry.


The B.C. Real Estate Association, the body that serves 23,000 realtors in B.C., said in April that it would join with four other agencies to keep the proceeds of crime out of real estate.


The other participating organizations include the Appraisal Institute of Canada, BC Notaries Association, Canada Mortgage Brokers Association and the Real Estate Board of Greater Vancouver.


Each organization has committed to sharing information, accepting only verified funds and making anti-money laundering education mandatory for its agents.


Provided by: The Canadian Press


Read

REBGV statement on government reports on money laundering

The BC government released reports today on the findings of two examinations into potential money laundering activities in the real estate market.


Real Estate of Board of Greater Vancouver President Ashley Smith issued the following statement on the findings of these investigations.


Our position on the money laundering concerns raised in recent years has remained consistent. The real estate profession is here to do everything we can to assist law enforcement in combating money laundering, or any other criminal activity, in our communities. Where there’s evidence of an individual violating the law, or the rules and regulations governing our profession, that individual should be identified and held accountable.


Rising home prices in recent years have highlighted concerns about money laundering and other issues within the local real estate market. Since 2016, the Real Estate Board of Greater Vancouver has met with and given feedback and information to every government body established in our province to look into these matters.


Last month, we also partnered with the BC Real Estate Association, the Appraisal Institute of Canada – BC Association, BC Notaries Association, Canadian Mortgage Brokers Association – British Columbia to submit joint recommendations to the provincial and federal governments on how to strengthen anti-money laundering measures in real estate.


The submission made five recommendations to government and suggests best practices for practitioners operating across the real estate sector. These include requiring only verifiable funds be used across the real estate sector and mandatory anti-money laundering education be introduced for all real estate professionals.


Our organization, on behalf of the more than 14,000 REALTORS® we represent, is here to help. We welcome today’s reports and stand ready to provide any other assistance the appropriate authorities may ask of us.


Provided by: REBGV

Read

Just Listed: 504 160 Shoreline Circle., Port Moody, College Park PM

Stunning Water & Mountain Views

Spacious Layout

Rentals Allowed

Price at $624,800


Click here for more...


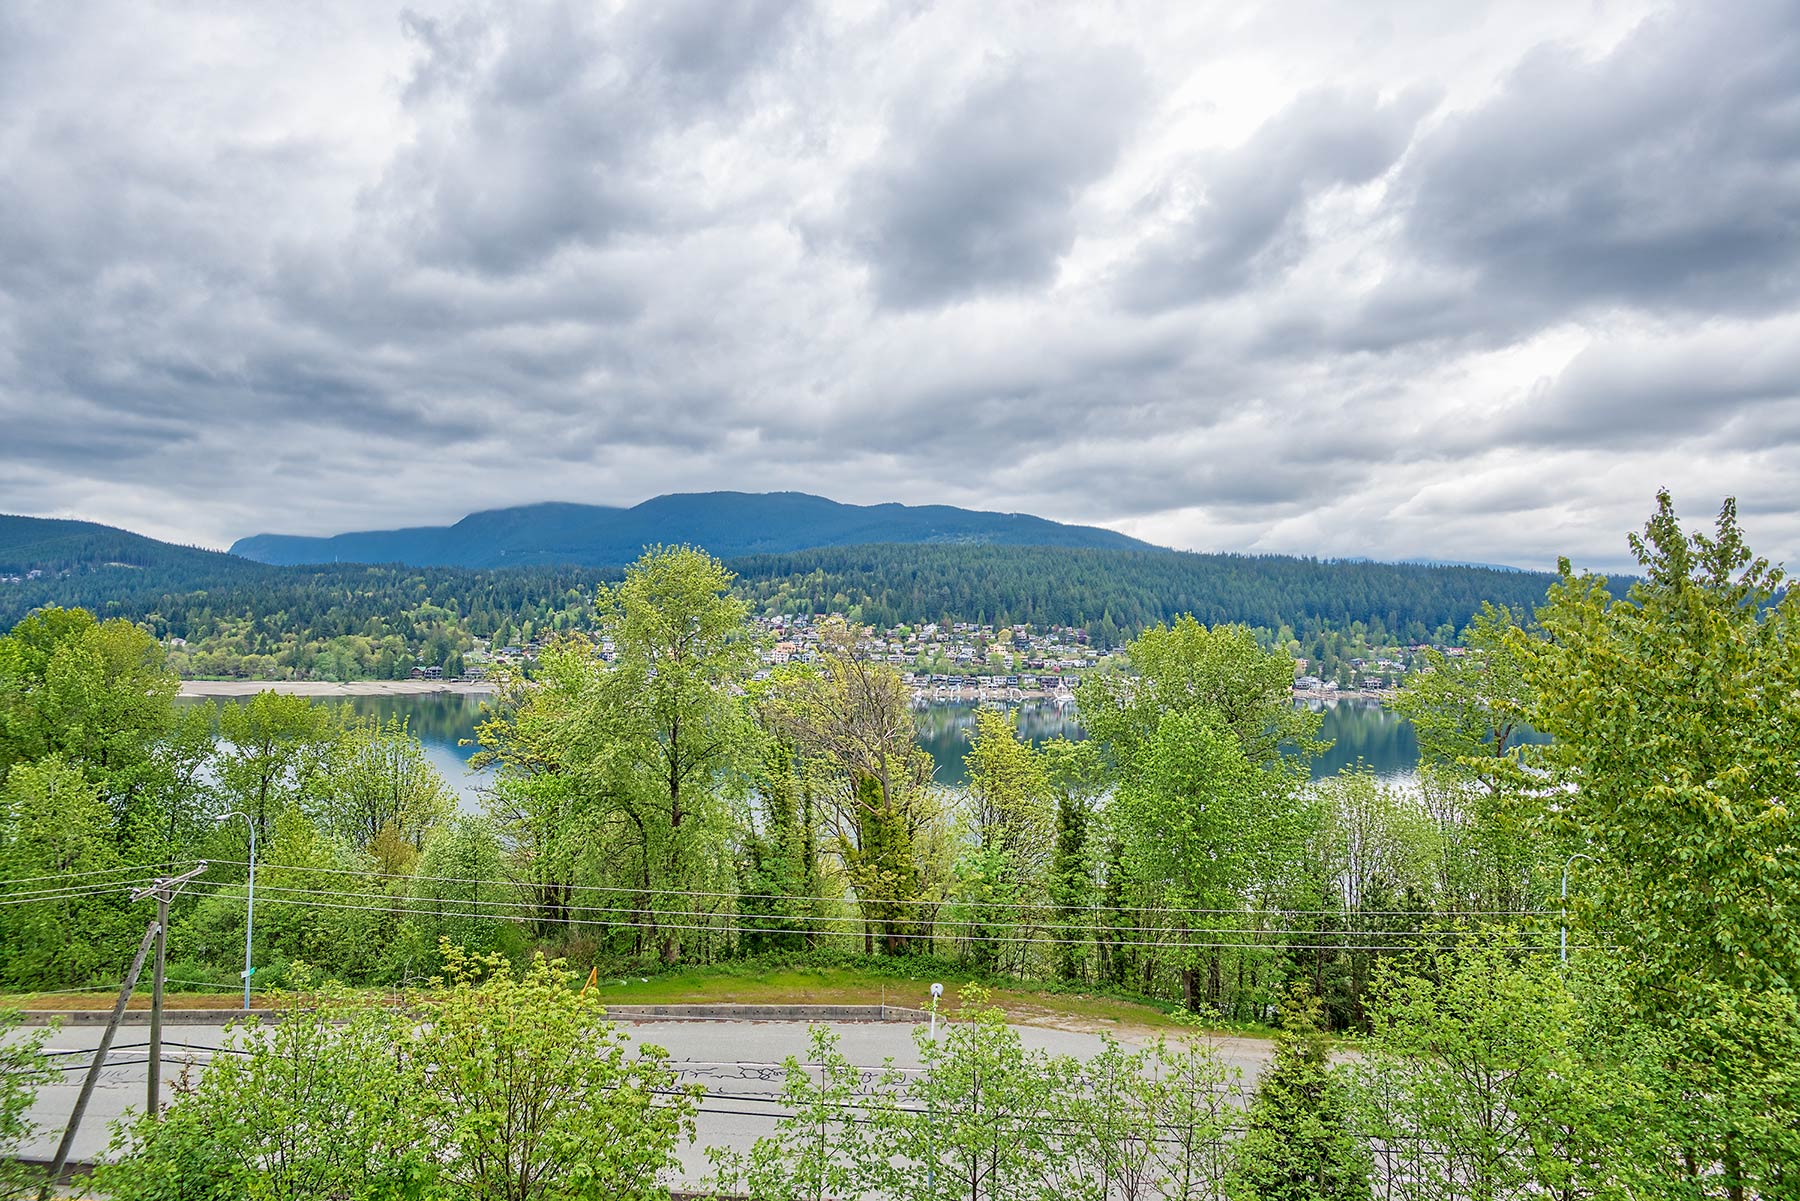
Come for the size, stay for the AMAZING Water and Mountain views! Nothing to do, just move-in. This 1179sqft/2bed & den/2bath top-floor home offers the feeling of a house & not a condo with an open functional layout and excellent room separation. Enjoy the views and BBQ's from a massive 152sqft balcony. Features: laminate floors, SS appliances, welcoming entrance, plenty of cupboard & counter space, in-suite storage, well-sized den, laundry room & an abundance of light. The spacious master offers room for king size bed, pass through closets & 4pc ensuite. The large 2nd bed has a view too & good closet space. Rental & pet friendly, parking & locker. Centrally located to: schools, parks, Rocky Point, Skytrain, Brewers Row & all sorts of amenities. Act Now! Call today. 

Read

Just Sold: 39 14909 32nd Ave., South Surrey White Rock

Single Level Duplex Style

End Unit with Updates

Price at $714,800


Click here for more...


Welcome Home! Your search ends here. Ponderosa is a desirable gated complex in sunny South Surrey located close to every type of amenity you can ask for. This fabulous 1401sqft/2bed/2bath single level duplex style end-unit home offers a spacious layout. Features: laminate floors, newer paint & appliances, plenty of storage, over-height ceilings, radiant floor heating, 2 cozy F/Ps, separate dining/living rms & family area off of the spacious kitchen w/breakfast bar & eating area. Enjoy the S/W facing fenced yard w/patio; complete w/power retractable awning. The large master has plenty of closet space & 5pc ensuite. Benefit from dble car garage, well maintained complex w/club house. Act Now!
Read
Reciprocity Logo The data relating to real estate on this website comes in part from the MLS® Reciprocity program of either the Greater Vancouver REALTORS® (GVR), the Fraser Valley Real Estate Board (FVREB) or the Chilliwack and District Real Estate Board (CADREB). Real estate listings held by participating real estate firms are marked with the MLS® logo and detailed information about the listing includes the name of the listing agent. This representation is based in whole or part on data generated by either the GVR, the FVREB or the CADREB which assumes no responsibility for its accuracy. The materials contained on this page may not be reproduced without the express written consent of either the GVR, the FVREB or the CADREB.