RSS

Just Listed: 511 200 Keary St., New Westminster, Sapperton


Awesome Central Location

Priced at $398,800

Open House:

May 24 from 4 to 6

May 27 from 3 to 5


Click here for more details....


Awesome location, beautiful water views, bright & spacious; what more could you ask for! This 748sqft/1bed/1bath home is in excellent condition, shows well & offers an open layout. Features: welcoming entrance, large kitchen with plenty of cupboard/counter space, excellent insuite storage space, a huge master bedroom with a large closet, cozy F/P, fully covered balcony and more. The Anvil, located in the heart of the Brewery District in New Westminster, offers concrete & steel construction & allows for pets & rentals. The location can’t get any better: steps away from Skytrain, bus route, RCH, ton of shopping, recreation & parks. Act Now! Call today for your private viewing. OPEN May 24 from 4 to 6 & May 27 from 3 to 5.

Read

Statistics released today by The Canadian Real Estate Association (CREA) show national home sales fell from March to April 2018.


Highlights:

  • National home sales fell 2.9% from March to April.
  • Actual (not seasonally adjusted) activity was down 13.9% from April 2017.
  • The number of newly listed homes declined 4.8% from March to April.
  • The MLS® Home Price Index (HPI) in April was up 1.5% year-over-year (y-o-y).
  • The national average sale price declined by 11.3% y-o-y in April.


National home sales via Canadian MLS® Systems declined by 2.9% in April 2018 to the lowest level in more than five years (Chart A). About 60% of all local housing markets reported fewer sales, led by the Fraser Valley, Calgary, Ottawa and Montreal.


Actual (not seasonally adjusted) activity was down 13.9% compared to April of last year and hit a seven-year low for the month. It also stood 6.9% below the 10-year average for the month. Activity was below year-ago levels in about 60% of all local markets, led overwhelmingly by the Lower Mainland of British Columbia and by markets in and around Ontario’s Greater Golden Horseshoe (GGH) region.


“The stress-test that came into effect this year for homebuyers with more than a twenty percent down payment continued to cast its shadow over sales activity in April,” said CREA President Barb Sukkau. “Its impact on housing markets varies by region,” she added. “A professional REALTOR® is your best source for information and guidance in negotiations to purchase or sell a home during these changing times,” said Sukkau.


“This year’s new stress test has lowered sales activity and destabilized market balance for housing markets in Alberta, Saskatchewan and Newfoundland and Labrador Provinces,” said Gregory Klump, CREA’s Chief Economist. “This is exactly the type of collateral damage that CREA warned the government about. As provinces whose economic prospects have faced difficulties because they are closely tied to those of natural resources, it is puzzling that the government would describe the effect of its new policy as intended consequences.”


The number of newly listed homes declined 4.8% in April. Having reached a nine-year low for the month, new listings stood 12% below the 10-year monthly moving average.


With sales having fallen by less than new listings, the national sales-to-new listings ratio firmed slightly to 53.7% in April compared to 52.6% in March. The long-term average for the measure is 53.4%.


A national sales-to-new listings ratio of between 40% and 60% is generally consistent with a balanced national housing market, with readings below and above this range indicating buyers’ and sellers’ markets respectively; however, the range consistent with balanced market conditions varies at the local market level.


For that reason, considering the degree and duration that market balance readings are above or below their long-term average is a better way of gauging whether local housing market conditions favour buyers or sellers. Market balance measures that are within one standard deviation of their long-term average are generally consistent with balanced market conditions.


Based on a comparison of the sales-to-new listings ratio with its long-term average, about 60% of all local markets were in balanced market territory in April 2018.


The number of months of inventory is another important measure for the balance between housing supply and demand. It represents how long it would take to liquidate current inventories at the current rate of sales activity.

There were 5.6 months of inventory on a national basis at the end of April 2018, the highest level since September 2015. The long-term average for the measure is 5.2 months.


The Aggregate Composite MLS® Home Price Index (MLS® HPI) was up 1.5% y-o-y in April 2018. This marks one full year of decelerating y-o-y gains. It was also the smallest y-o-y increase since October 2009. (Chart B)

Decelerating y-o-y home price gains largely reflect trends among GGH housing markets tracked by the index. Home prices in the region have stabilized and have begun trending higher on a monthly basis; however, rapid price gains recorded one year ago have contributed to deteriorating y-o-y price comparisons.


Apartment units again posted the largest y-o-y price gains in April (+14.7%), followed by townhouse/row units (+6.5%). By contrast, one-storey and two-storey single family home prices were down (-1.1% and -4.8% y-o-y respectively).


With this release, housing market coverage for MLS® HPI now includes Barrie and District. Benchmark home prices in April were up from year-ago levels in 9 of the 15 markets tracked by the index.


Composite benchmark home prices in the Lower Mainland of British Columbia continue to trend upward after having dipped briefly in the second half of 2016 (Greater Vancouver (GVA): +14.3% y-o-y; Fraser Valley: +22.7% y-o-y).


Apartment and townhouse/row units have been largely driving this regional trend while single family home prices in the GVA have stabilized. In the Fraser Valley, single family home prices have now also begun to rise.


Benchmark home prices continued to rise by about 14% on a y-o-y basis in Victoria and by about 20% elsewhere on Vancouver Island.


Within the GGH region, price gains have slowed considerably on a y-o-y basis but remain above year-ago levels in Guelph (+5.9%). By contrast, home prices in the Greater Toronto Area (GTA), Oakville-Milton and Barrie and District were down from where they stood one year earlier (GTA: -5.2% y-o-y; Oakville-Milton: -8.7% y-o-y; Barrie and District: -8.4% y-o-y). This reflects rapid price gains recorded one year ago and masks recent month-over-month price gains in these markets.


Calgary and Edmonton benchmark home prices were again little changed on a y-o-y basis (Calgary: +0.1% y-o-y; Edmonton: -0.9% y-o-y), while prices in Regina and Saskatoon remained down from year-ago levels (-6.5% y-o-y and -3.4% y-o-y, respectively).


Benchmark home prices rose by 8.4% y-o-y in Ottawa (led by a 9.4% increase in two-storey single family home prices), by 6.3% in Greater Montreal (led by a 7.3% increase in two-storey single family home prices) and by 4.2% in Greater Moncton (led by a 5.6% increase in one-storey single family home prices). (Table 1)


The MLS® HPI provides the best way of gauging price trends because average price trends are strongly distorted by changes in the mix of sales activity from one month to the next.


The actual (not seasonally adjusted) national average price for homes sold in April 2018 was just over $495,000, down 11.3% from one year earlier.


The national average price is heavily skewed by sales in the GVA and GTA, two of Canada’s most active and expensive markets. Excluding these two markets from calculations cuts more than $109,000 from the national average price to just under $386,100 and trims the y-o-y decline to 4.1%.


PLEASE NOTE: The information contained in this news release combines both major market and national sales information from MLS® Systems from the previous month. 

CREA cautions that average price information can be useful in establishing trends over time, but does not indicate actual prices in centres comprised of widely divergent neighbourhoods or account for price differential between geographic areas. Statistical information contained in this report includes all housing types. 

MLS® Systems are co-operative marketing systems used only by Canada’s real estate Boards to ensure maximum exposure of properties listed for sale. 

The Canadian Real Estate Association (CREA) is one of Canada’s largest single-industry trade associations, representing more than 125,000 REALTORS® working through some 90 real estate Boards and Associations.

Read

Younger homebuyers, who aim for cheaper mortgage options, will feel the impact the most


Expect a modest slowdown in housing activity and more demand for cheaper housing with the new qualifying mortgage rate, some experts say.


The Bank of Canada raised its mortgage qualifying rate to 5.34 per cent this week, meaning borrowers now face a higher bar in the federally mandated stress test. The rate was previously 5.14 per cent.


The qualifying rate, different from actual rates offered by lenders, is used as a benchmark to determine borrower eligibility. The rate is up from 4.64 per cent this time last year.


Borrowers with less than a 20 per cent down payment seeking mortgage insurance have to qualify at the Bank of Canada benchmark rate. Effective this past January, borrowers who don’t need mortgage insurance must prove they could handle either the Bank of Canada rate or two percentage points higher than their contractual mortgage rate, whichever rate is greater.


Canada’s big banks — TD, RBC, CIBC, Scotiabank, National and BMO — all recently raised their five-year fixed mortgage rates.


Robert Goodall, president and CEO of Atrium Mortgage Investment Corporation, said rate increases tend to have a psychological impact on buyers.

“When rates rise at this time of year, it can be demoralizing and a hit to consumer confidence,” agreed Phil Soper, President and CEO of Royal LePage.


However, Soper is optimistic that consumer sentiments will recover given the strength of employment and the economy in Canada.


He believes younger homebuyers, who aim for cheaper mortgage options, will feel the impact the most.


“There’s a general tendency for younger buyers and first-time homebuyers to be more conservative when it comes to mortgage financing,” he said. “They have a tendency to look for the most conservative product on the market, which is now getting more expensive.”


For Robert Hogue, a senior economist with RBC, qualifying rate increases could potentially lead to a restraining of demand from homebuyers.


As well, there will likely be more of a concentration of demand towards lower-priced homes due to the toll higher qualifying rates may have on buyers’ budgets, Hogue said.


“It doesn’t mean that people will stop qualifying,” he said. “New borrowers will continue to be able to qualify, but for a lesser amount.”


Provided By: The Vancouver Sun

Read

Towers aplenty get early OK from Coquitlam

Hundreds of new condos and rental units in the works 

The pace of highrise condo construction in Coquitlam does not appear to be slowing down. 

Council approved first reading for three projects Monday night that will add a total of 650 housing units to the city’s residential stock.


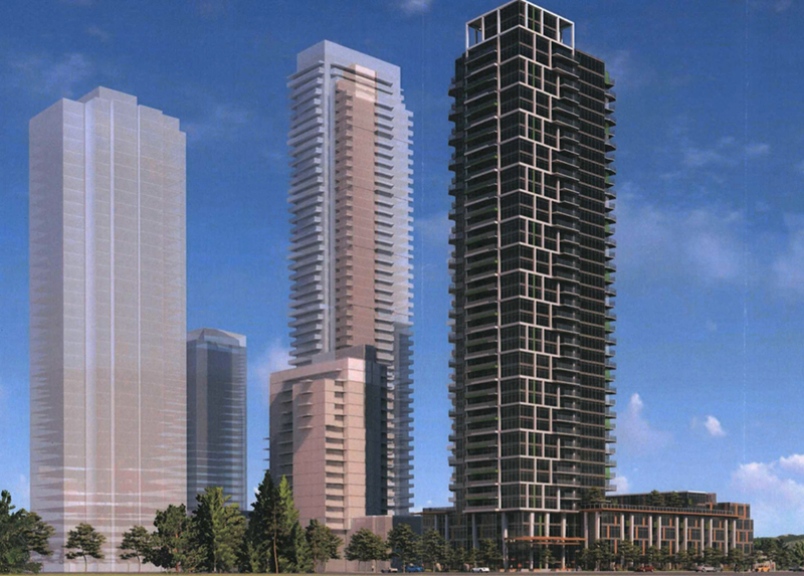
The largest project is planned for Glen Drive and Westwood Street in the City Centre neighbourhood, where Polygon Developments is proposing a 40-storey, mixed-use tower, with podium-style ground-level commercial units. 


Fifty-one of the 273 units would be rentals while 222 would be market condos on a site currently occupied by several houses. The project would also feature four floors of commercial office space. 


While the 40-storey tower is being built by Polygon, the Onni group owns the land directly to the west of the project along Pinetree Way, where it is proposing to build three more towers. The two projects would move forward on separate timelines but are being designed by the same architectural firm. 


The second-largest tower, which had its first reading approved during Monday night’s council meeting, would be located on Sydney Avenue and Westview Street (near the Burnaby border at North Road and Austin Avenue). 

The 25-storey project, another podium and tower, is expected to have 235 units, with 157 market condos, 69 market rentals and nine below-market rental units. The five-storey podium would hold an amenity space and the rental units, according to a city staff report.


The final tower development to receive first reading Monday night is a 21-storey project located at Lougheed Highway and Blue Mountain Street. The proposed development would include eight townhouse units and a mixed-use space at the ground-floor level and a tower with four ground-floor commercial units and 142 market condo units.

All three towers will now move forward to the public hearing phase of the city’s application process. Public hearing dates are posted and updated at coquitlam.ca. 


NEW DOCK AT COMO LAKE

Pedestrians walking the loop at Coquitlam’s Como Lake will be detoured as the city works to replace a dock on the east side of the lake.


Signs have been posted on site to help park users avoid machines and equipment being used on the project, which is expected to be wrapped up by the end of the week.


According to the city, the new dock will provide lake visitors with a wider and longer platform. 


Provided By: Gary McKenna - gmckenna@tricitynews.com

Photo - Photograph By File Photo

Read

BC Home Sales Show Little Change in April

The British Columbia Real Estate Association (BCREA) reports that a total of 8,203 residential unit sales were recorded by the Multiple Listing Service® (MLS®) across the province in April, a 16.8 per cent decrease from the same month last year. The average MLS® residential price in BC was $730,507, up 0.2 per cent from the previous year. Total sales dollar volume was $5.99 billion, a 16.7 per cent decline from April 2017.

“BC home sales were essentially unchanged in April compared to March, albeit up nearly 1 per cent on a seasonally adjusted basis,” said Cameron Muir, BCREA’s Chief Economist. “The impact of more burdensome mortgage qualifications for conventional borrowers is expected to soften over the next several months as potential buyers adjust both their finances and expectations.”

The supply of homes for sale in April increased 4 per cent from the previous month. However, total active listings on the market continue to remain low from a historical perspective. Most regions of the province have begun trending toward more balance between supply and demand, causing less upward pressure on home prices.

Year-to-date, BC residential sales dollar volume was down 6.7 per cent to $19.9 billion, compared with the same period in 2017. Residential unit sales decreased 11.8 per cent to 27,135 units, while the average MLS® residential price was up 5.7 per cent to $731,661.


April 2018 Residential Average Price, Active Listings and Sales-to-Active-Listings Data by Board


Board

Average Price

Active Listings

Sales-to-Active-Listings

April 2018 Residential Average Price ($)

April 2017 Residential Average Price ($)

%

change

April 2018 Residential Active Listings (Units)

April 2017 Residential Active Listings (Units)


% change

April 2018 Residential Sales to Active Listings (%)

April 2017 Residential Sales to Active Listings (%)

BC Northern

291,106

284,184

2.4

1,906

2,348

-18.8

20.6

14.8

Chilliwack

533,020

460,388

15.8

989

909

8.8

36.5

40.9

Fraser Valley

780,736

708,633

10.2

4,526

3,709

22

35.6

57.6

Greater Vancouver

1,067,266

1,056,136

1.1

10,474

8,436

24.2

25.1

42.9

Kamloops

371,459

360,723

3

1,044

1,198

-12.9

29.8

27.1

Kootenay

297,070

311,753

-4.7

1,699

2,098

-19

17.1

13.5

Okanagan Mainline

517,149

478,715

8

3,223

2,959

8.9

23.1

27.7

Powell River

352,724

304,211

15.9

70

107

-34.6

47.1

33.6

South Okanagan

440,828

384,804

14.6

964

966

-0.2

22.8

20

Northern Lights

280,166

244,811

14.4

383

382

0.3

7.3

6

Vancouver Island

470,435

422,719

11.3

2,182

2,264

-3.6

38.5

38

Victoria

703,592

629,040

11.9

1,480

1,194

24

50

70.9

Provincial Totals*

730,507

729,084

0.2

28,940

26,570

8.9

28.3

37.1

*Numbers may not add due to rounding

BCREA is the professional association for about 23,000 REALTORS® in BC, focusing on provincial issues that impact real estate. Working with the province’s 11 real estate boards, BCREA provides continuing professional education, advocacy, economic research and standard forms to help REALTORS® provide value for their clients. 

To demonstrate the profession’s commitment to improving Quality of Life in BC communities, BCREA supports policies that help ensure economic vitality, provide housing opportunities, preserve the environment, protect property owners and build better communities with good schools and safe neighbourhoods.
For detailed statistical information, contact your local real estate board. MLS® is a cooperative marketing system used only by Canada’s real estate boards to ensure maximum exposure of properties listed for sale.

Read

Sold In 7 Days: 313 295 Schoolhouse., Coquitlam, Maillardville

First Time Buyers

Functional Layout

Priced at $390,000

Open: May 5 from 2 to 4


Click here for more details....


A location that can't be beat. Tastefully updated throughout. Desirable building. What more could you ask for? Cute 1 bed, 1 bath, 692sqft home shows well; you won't be disappointed. Features: NE facing covered balcony looking onto green space for extra privacy, open efficient floor plan, laminate floors, stainless appliances, modern paint colors, plenty of cupboard & counter space, laundry w/extra storage & cozy gas fireplace. Spacious master offers large walk-through closets w/organizers & 4 piece cheater ensuite. Walking distance to transit, all types of shops & restaurants, close to recreation & a short ride to Lougheed or Braid Skytrain. Bonus: 1 parking, locker & pet friendly. Act Now! Open May 5 from 2 to 4.


Read

Just Listed: 306 4160 Albert St., Burnaby, Vancouver Heights

Completely Renovated

Price at $598,800

Open House:

May 10 from 4 to 6

May 12 from 1 to 3


 Click here for more details....


Absolutely Stunning! Completely renovated. Nothing to do but move right in. You won't be disappointed. Awaits you is a bright south facing 845sqft/1bed/1bath concrete constructed home in popular Carlton Terrace of Vancouver Heights. Fresh, modern & clean. Brand new: wide plank laminate floors, ceramic tiles, kitchen cupboards, quartz counters, SS apps, blinds, all fixtures, door handles & hinges, paint & W/D. Redone bathroom w/vanity, quartz counters, tub-surround & new aqua drywall. Enjoy the huge master w/loads of closet space & direct access to a covered 138sqft balcony. Bonus: in-suite storage, 1 parking & locker. Close to: schools, transit, rec & all types of amenities. Act Now. Open May 10 from 4-6 & May 12 from 1-3.


Read

Just Sold: 1701 9060 University Cr., Simon Fraser University

Want to live at the highest point of Vancouver? Look no further, Altitude by Hallmark. This exceptional PENTHOUSE has 3 bdrms, 3 bathrooms & 1 den, along with 1,257 sq ft roof deck. The Seller requested the developer to merge two bedrooms into one bedroom during construction. Currently there are two bedrooms, but it can be turned back to three bedrooms as the original floor plan easily. Tons of improvement including California closet, black-out blinds, & outdoor living furniture such as heat lamps & fire pit, etc. 1 block to SFU, Campus, bus loop. Supermarket, cafes & eateries. 2 year young rental & pet friendly building. Low maintenance fee includes heat! With gym, lounge/clubhouse, kids play area, BBQ terrace, overheight ceiling. 2 parking, 1 locker.


 Click here for more details....


Listing Offered by: Maxcel WestCoast Realty Ltd.

Read

Just Sold: 109 20078 Fraser Hwy., Langley, Langley City

Large Patio

Thoughtful Layout

Priced at $358,800


Click here for more details....


Completely updated. Large 127sqft patio. This stunning 1bed/1bath/586sqft home located in the popular Varsity complex in Langley City will not disappoint. Built by awarding winning Redekop Kroeker, quality workmanship & finishing can be seen throughout. Upgrades: wide plank vinyl water resistant flooring, gorgeous haring bone back-splash, bedroom carpets, baseboards, designer paints, light fixtures, toilet, vanity & bathroom sink. Features: efficient layout, plenty of natural light, over-height ceilings, SS apps, gas stove & more. Enjoy the spacious master w/walk-through closet & cheater ensuite. Relax on the private partial covered patio complete w/gas hook-up. Rental & pet friendly! Act Now! 

Read

Just Sold: 20933 80B Ave., Langley, Willoughby Heights

Family Friendly Location

Spacious Layout

Priced at $1,068,800


 Click here for more details....


The perfect family home in highly sought Yorkson neighborhood of Willoughby Heights. This 5+bed/4bath/2582sqft/3yr home shows well, offers a great room layout & modern finishing's; you won't be disappointed! Main lvl: 9' ceilings, spacious kitchen w/large island, quartz counters, SS apps, 2pc powder, access to dbl car garage & walk-out to fenced yard w/extra concrete patio space; ideal for family BBQs. Up: gorgeous vaulted master, huge walk-in & spa inspired 5pc ensuite. 2 large rooms, conveniently located laundry & open den (easily converted to 4th bed), complete this level. Down: 1 bed suite & media room or 2 bed suite, you choose. Location: close to schools, amenities, parks, Hwy access & more. Act Now! 

Read

The Canadian Real Estate Association (CREA) is proposing an amendment to Bill C-45 that would result in a moratorium on home cultivation of cannabis until the governments can enact rules and regulations for the entire country.


While speaking in front of Senate Standing Committee on Social Affairs, Science and Technology, Michael Bourque, CEO of CREA, which represents more than 125,000 REALTORS® across the country, outlined some of the hazards associated with home cannabis cultivation. “We know fire chiefs are concerned about fires; police organizations are concerned with increased crime; municipalities have concerns about safety and cost; health authorities are concerned about vulnerable people exposed to fungus and mould” Bourque said.


Under the federal government’s Cannabis Act, also known as Bill C-45, Canadians will be allowed to grow up to four cannabis plants at a time. Under the right conditions, yields could reach over five kilograms a year. At that level of production, four plants have the potential to damage property, endanger at-risk populations and increase housing costs, especially for lower income Canadians.


“We’ve heard from homeowners and tenants across the country who are worried about living beside grow-ops. What does this do to their home value? Will this increase their rent? How safe will their kids be? Will their quality of life diminish because of the prevalence of drugs in their neighbourhood? These are all concerns that need to be considered before the passing of Bill C-45,” said CREA’s President Barb Sukkau.


Before Bill C-45 is passed, CREA believes the government must provide a framework to provinces, territories and municipalities on regulations and guidelines for safe home cultivation.


CREA is asking Senators to include an amendment to the Bill that would put home cultivation on hold until provinces can enact new regulations and is suggesting that the Federal government provide guidelines for those regulations.


Provided by: CREA

Read
Reciprocity Logo The data relating to real estate on this website comes in part from the MLS® Reciprocity program of either the Greater Vancouver REALTORS® (GVR), the Fraser Valley Real Estate Board (FVREB) or the Chilliwack and District Real Estate Board (CADREB). Real estate listings held by participating real estate firms are marked with the MLS® logo and detailed information about the listing includes the name of the listing agent. This representation is based in whole or part on data generated by either the GVR, the FVREB or the CADREB which assumes no responsibility for its accuracy. The materials contained on this page may not be reproduced without the express written consent of either the GVR, the FVREB or the CADREB.