RSS

A repeat of Toronto's 1989 crash could have devastating effects on the entire economy


It's the question lingering behind every headline. It's whispered among homeowners, would-be buyers and sellers, economists and policy-makers. What actually happens if Canadian real estate prices crash?


On the one hand, a crash might be good for some Canadians already priced out of the market. And even a dramatic 40 per cent drop in prices would set homeowners in markets like Toronto or Vancouver back, what, two or three years?


But there are broader concerns for the market and the economy itself that could prove devastating.


Home prices are notoriously off the charts. Everyone from the governor of the Bank of Canada to the chatty guy in your local cafe has said, repeatedly, that this increase in prices is not sustainable. But what that means, precisely, is vague.

The latest numbers from the Canadian Real Estate Association show the average home price in Canada climbed by 10 per cent to $559,317 in April. Notably, the number of sales in Toronto's red-hot market fell by almost seven per cent but prices continued to rise. 


No one is saying the end is nigh. Most are still banking on that ambiguous "soft landing" policy-makers have talked about for years. But, for the sake of argument and for a better understanding of the risks, let's talk about what a real crash would look like.


First of all, what is a real crash? Think Toronto in 1989. Prices fell off a cliff. The average cost of a home in Toronto hit a whopping $273,698, a 30-year high. Then the bottom fell out.


By 1996, that average had fallen to $198,150. (Yes, you read that right, you could buy a home in Toronto for a mere fraction of the $920,000 it costs today.)


Like then, some owners would be largely unaffected by a crash today. Someone who isn't going to move and has a lot of equity in the house would be set back, but given the enormous increase in house prices (33 per cent in 2016), they would have something of a cushion.


But housing isn't just about prices. And that's never more evident than during a downturn.

"I think the most important thing is the impact on the composition of economic growth," says Karl Schamotta, director at Cambridge Global Payments. He says for 17 years, Canadian real estate, retail finance and construction sectors have significantly outpaced the rest of the economy. That cycle has fed on itself.


"Rising loan volumes and attractive spreads have bolstered the finance sector. Driven by more lending, home prices have risen, allowing households to borrow more money and spend more in the retail sector," says Schamotta.


Were that cycle to stop or suddenly slow, the impact would stretch far beyond Toronto's overheated housing circus.

Hurting the entire economy

Joblessness would spike, and it would be made worse by people's reluctance to move for work because they are tied to monster mortgages for homes worth less than they paid, Schamotta says.


That would be bad for productivity, but it would also make Canada's entire economy less able to react to global changes. And the loonie would likely fall, too, hurting imports while boosting exports.


And even those homeowners who have equity in their homes and don't plan on leaving wouldn't be immune.


Benjamin Tal, deputy chief economist at CIBC World Markets, says the important question isn't how far prices would fall, but why they fell in the first place. If prices fell because Toronto's well established supply issue was sorted out, that could actually prove positive for the economy.


But if they fell as a result of a quick rise in interest rates, as happened in the United States in 2006, the impact could be severe. 

"The higher interest rate environment would lead to a significant increase in debt financing as opposed to other spending," says Tal. That would require people to spend more covering their mortgage and leave them with less to spend elsewhere in the economy.


"Then you get into a consumer-led recession. And this would lead to increased unemployment and people defaulting and continued decline in prices. That's the worst scenario."

A cascading correction?

The wealth effect is an economic theory that for every increase in wealth there's a disproportionate increase in spending. In housing terms, that means that for every one per cent increase in prices, we usually see spending go up about five per cent. Tal says the reverse is also true, that for every one per cent fall in prices, people spend disproportionately less.


Based on this theory, it's not hard to see why a double-digit correction in prices could cascade through other parts of the economy, "and that can feed on itself," says Tal.


On the upside, just about everyone agrees that nightmare scenario is still unlikely. Prices are slowing in Toronto and Vancouver. And Tal says one big difference between today's situation and the U.S. housing crash is that everyone in this country is trying to slow down the market.


"It's banks, even developers, clearly policy-makers. You don't have the situation where banks are seeing green and trying to maximize profits. In fact they are really trying to slow it down. Regulators are trying to slow it down and more is coming."


Peter Armstrong

On the Money on CBC News Network

Read

Gorgeous Forest Views

1 Year Young

Priced at $374,800


Investor, student and first time buyer alert! This 1bed/1bath/545sqft above-ground home offers floor to ceiling windows and is nestled in lush forest and green space views. Features: an efficient floor plan, quality engineered floors, GE Cafe appliances, quartz counters, a spacious kitchen w/breakfast bar & covered balcony. Spacious master has large closet space. Altitude is Vancouver’s highest rising tower, 1 yr young & rental & pet friendly. Bonus: locker & parking. Walk to: transit, campus, childcare, shopping, indoor/outdoor rec. & a host of resident-only perks. Do not miss your chance to enjoy living in this great lifestyle neighborhood! Act Now! 


Read

According to statistics[1] released today by The Canadian Real Estate Association (CREA), national home sales declined in April 2017.

Highlights:

  • National home sales fell 1.7% from March to April.
  • Actual (not seasonally adjusted) activity in April was down 7.5% from a year earlier.
  • The number of newly listed homes jumped 10% from March to April.
  • The MLS® Home Price Index (HPI) was up 19.8% year-over-year (y-o-y) in April 2017.
  • The national average sale price rose 10.4% y-o-y in April.

Home sales over Canadian MLS® Systems fell by 1.7% in April 2017 from the all-time record set in March. (Chart A)

Chart A

Chart A

April sales were down from the previous month in close to two-thirds of all local markets, led by the Greater Toronto Area (GTA) and offset by gains in Greater Vancouver and the Fraser Valley.


Actual (not seasonally adjusted) activity was down 7.5% year-over-year, with declines in close to 70% of all local markets. Sales were down most in the Lower Mainland of British Columbia, where activity continues to run well below last year's record-levels. The GTA also factored in the decline, with faded activity compared to record levels set in April last year.


"Sales in Vancouver are down from record levels in the first half of last year but the gap has started to close," CREA President Andrew Peck. "Meanwhile, sales are up in Calgary and Edmonton from last year's lows and trending higher in Ottawa and Montreal. All real estate is local, and REALTORS® remain your best source for information about sales and listings where you live or might like to."


"Homebuyers and sellers both reacted to the recent Ontario government policy announcement aimed at cooling housing markets in and around Toronto," said Gregory Klump, CREA's Chief Economist. "The number of new listings in April spiked to record levels in the GTA, Oakville-Milton, Hamilton-Burlington and Kitchener-Waterloo, where there had been a severe supply shortage. And with only ten days to go between the announcement and the end of the month, sales in each of these markets were down from the previous month. It suggests these housing markets have started to cool. Policy makers will no doubt continue to keep a close eye on the combined effect of federal and provincial measures aimed at cooling housing markets of particular concern, while avoiding further regulatory changes that risk producing collateral damage in communities where the housing market is well balanced or already favours buyers."


The number of newly listed homes jumped 10% in April 2017, led overwhelmingly by a 36% increase in the GTA. Housing markets in the Greater Golden Horseshoe also saw similar percentage increases.


The jump in new listings and drop in sales eased the national sales-to-new listings ratio to 60.1% in April compared to 67.3% in March.


A sales-to-new listings ratio between 40 and 60 is generally consistent with balanced housing market conditions, with readings below and above this range indicating buyers' and sellers' markets respectively.

The ratio was above 60% in just over half of all local housing markets in April, mostly in British Columbia and southwestern Ontario. The GTA downshifted into the middle of the balanced range in April, while Greater Vancouver and the Fraser Valley have returned to sellers' market territory.


The number of months of inventory is another important measure of the balance between housing supply and demand. It represents how long it would take to completely liquidate current inventories at the current rate of sales activity.


There were 4.2 months of inventory on a national basis at the end of April 2017, up slightly from 4.1 months in March when it fell to its lowest reading in almost a decade.


Although new listings surged in the Greater Golden Horseshoe, inventories remain tight at near or below one month across the region. Ontario's recent changes to housing policy were announced late in the month, so their full effect on the balance between supply & demand has yet to be determined.


The Aggregate Composite MLS® HPI rose by 19.8% y-o-y in April 2017. Price gains accelerated for all benchmark housing categories tracked by the index. (Chart B)

Chart B

Chart B


Two-storey single family homes posted the strongest year-over-year price gains (+21.8%), followed closely by townhouse/row units (+19.9%), apartment units (18.8%) and one-storey single family homes (17.2%).


While benchmark home prices were up from year-ago levels in 11 of 13 housing markets tracked by the MLS® HPI, price trends continued to vary widely by location.


After having dipped in the second half of last year, home prices in the Lower Mainland of British Columbia have been recovering, are up from levels one year ago, and are now at new heights or trending toward them (Greater Vancouver: +11.4% y-o-y; Fraser Valley: +18% y-o-y).


Meanwhile, benchmark home price gains remained in the 20% range in Victoria and elsewhere on Vancouver Island. Price gains were in the 30% range in Greater Toronto and Oakville-Milton, and ranged in the mid-20% in Guelph.


By comparison, home prices eased in Calgary (-0.9% y-o-y) and Saskatoon (-2.6% y-o-y) and are now about 5.5% below their peaks reached in 2015.


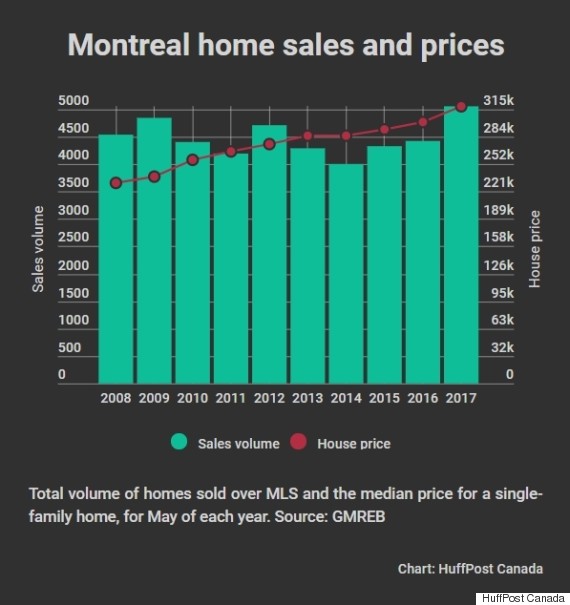
Home prices were up modestly from year-ago levels in Regina (+0.4% overall, led by a 2% increase in apartment prices), Ottawa (+4% overall, led by a 4.9% increase in two-storey single family home prices), Greater Montreal (+3.7% overall, led by a 5.5% increase in prices for townhouse/row units) and Greater Moncton (+4.8% overall, led by a 12.7% increase in prices for townhouse/row units). (Table 1).


The MLS® Home Price Index (MLS® HPI) provides the best way of gauging price trends because average price trends are prone to being strongly distorted by changes in the mix of sales activity from one month to the next.


The actual (not seasonally adjusted) national average price for homes sold in April 2017 was $559,317, up 10.4% from where it stood one year earlier.


The national average price continues to be pulled upward by sales activity in Greater Vancouver and Greater Toronto, which are two of Canada's most active and expensive housing markets. Excluding these two markets from calculations trims more than $150,000 from the average price.


Provided by: CREA - Canadian Real Estate Association

Read

The British Columbia Real Estate Association (BCREA) reports that a total of 9,865 residential unit sales were recorded by the Multiple Listing Service® (MLS®) in April, down 23.9 per cent from the same period last year. Total sales dollar volume was $7.19 billion, down 25.4 per cent from April 2016. The average MLS® residential price in the province was $728,955, a 2 per cent decrease from the same period last year.

“BC home sales are on an upward trend this spring, led by a sharp increase in consumer demand in the Lower Mainland,” said Cameron Muir, BCREA Chief Economist. The seasonally adjusted annual rate (SAAR) of home sales was over 106,000 units in April, significantly above the five-year SAAR for April of 89,000 units.

The supply of homes for sale declined 17 per cent from April 2016. On a seasonally adjusted basis, active residential listings have declined 50 per cent since 2012 and are now at their lowest level in over 20 years. The imbalance between supply and demand is continuing to drive home prices higher in most regions, further eroding affordability.

Year-to-date, BC residential sales dollar volume was down 31.8 per cent to $21.3 billion, when compared with the same period in 2016. Residential unit sales declined 25.0 per cent to 30,757 units, while the average MLS® residential price was down 9.2 per cent to $692,220.


Read

Home prices in Canada rose for the 15th straight month in a row in April, according to the Teranet-National Bank house price index, which once again hit its highest levels ever.


But virtually all the strength seen over the past year came from just three cities — Toronto, Hamilton and Victoria.


The index, which tracks repeat sales of single-family homes over time, found Toronto led the way, with the price index rising 2.6 per cent in April. The city has seen prices jump 7.3 per cent since the start of the year, and 26.3 per cent in the past 12 months.


Nearby Hamilton, which is experiencing spillover from Toronto’s housing boom, saw its price index rise 2 per cent in April and 23 per cent over the past year.


Vancouver, which as recently as a year ago was showing the fastest price growth in the country, is now showing signs of slowing. The price index fell 0.1 per cent in April, and compared to a year ago, prices are up 9.7 per cent, slower than the national average of 13.4 per cent.


Many market experts say Vancouver’s foreign buyer tax has pushed buyers to other cities, including to Victoria, where the price index rose 1.5 per cent in April, and 19 per cent over the past year.


“Based on the cooldown in home sales that began early last year, we expect the Vancouver growth rate to fall much lower over the next few months,” wrote David Madani, senior Canada economist at Capital Economics.


But Madani expects Toronto to experience a similar cooling. He noted that the city saw a sudden, 30-per-cent spike in new home listings in April.


That’s “further evidence that the surge in house price inflation is close to a peak and will drop back sharply before the end of this year,” he wrote in a client note.


Not everyone agrees. National Bank senior economist Marc Pinsonnault said he doesn't see much of a slowdown in prices ahead, even with the new housing rules Ontario announced last month.


The provincial government last month announced a slate of 16 measures to address a growing affordability crisis. Among them are a 15-per-cent tax on foreign home buyers, expanded rent controls and the ability for municipalities to charge a tax on vacant homes.


"The effect of that tax on homes sales and home price growth will be assessed over the next few months," Pinsonnault wrote in a client note.


"But even if this measure curbs speculation, it should not bring home price growth to a halt due to strong fundamentals such as job creation, immigrants from other countries and lately a net flow of migrants from other provinces. Low interest rates also contribute to the housing boom."


Provided By: Daniel Tencer with The Huffington Post

Read

Increases in home prices in the City of Vancouver have had a spillover effect in surrounding British Columbia municipalities. Centres within commuting distance of Vancouver City experienced the strongest spillover effect, however, price increases could also be seen in municipalities outside commuting range.


This analysis is part of Canada Mortgage and Housing Corporation’s (CMHC) latest Housing Market Insight (HMI) report on the link between Vancouver home prices and other major centres in British Columbia.

Report highlights

  • Home price changes in the City of Vancouver have a measurable effect (and in the same direction) on the home prices of other municipalities.
  • Stronger spillover effects are seen in municipalities closest to Vancouver, such as Richmond and the North Shore. As the distance from Vancouver increases, the spillover effects generally become weaker.
  • House prices in municipalities that are outside of the commuting range are still affected by price changes in Vancouver. Migration out of Vancouver provides another potential channel for spillover effects.

The exact causes of spillover effects are complex and change over time. There are other factors that may have cancelled out past spillover effects or amplified them, depending on the particular example. These results are based on changes in the City of Vancouver home prices in isolation of other factors that would lead house prices to fluctuate jointly in several B.C. centres.


To access future market analysis reports from CMHC, subscribe to Housing Observer Online.


As Canada’s authority on housing, CMHC contributes to the stability of the housing market and financial system, provides support for Canadians in housing need, and offers objective housing research and information to Canadian governments, consumers and the housing industry.


“Price changes in the City of Vancouver are linked to prices in other municipalities, both on the way up and on the way down. The spillover effects take years to fully work through other markets and have varying degrees of strength.”

— Braden Batch, Senior Market Analyst, Market Analysis Centre, Canada Mortgage and Housing Corporation

Read

Canada Mortgage and Housing Corporation (CMHC) today released its 2016 Annual Report titled “Innovating for Better Housing Outcomes”.


In 2016, CMHC supported over 500,000 Canadian households through long-term social housing commitments and provided mortgage loan insurance for more than 350,000 homes. The report captures how CMHC, as Canada’s authority on housing, contributes to the stability of the housing market and financial system while providing support for Canadians in housing need.

Contributing to stability of the housing market and financial system

  • Mortgage loan insurance facilitates access to housing finance for qualified Canadian homebuyers, supporting the stability of our financial system and economic growth. In 2016, CMHC provided $64 billion of mortgage loan insurance for more than 350,000 homes. Of our approved homeowner applications, 14.1% were in rural areas and 64.3% supported first time home buyers. As at 31 December 2016, total insurance-in-force stood at $512 billion.
  • CMHC’s securitization programs facilitate access to funds for residential mortgage lending. This contributes to the stability of Canada’s financial system and supports competition in the mortgage market. In 2016, CMHC provided $144.4 billion in guarantees through its securitization programs.
  • CMHC’s mortgage loan insurance and securitization activities operate on a commercial basis without the need for funding from the Government. As a result of these activities, CMHC generated a net income of $1.4 billion for the year ended 31 December 2016. At year end, total mortgage insurance capital available was $18.6 billion, representing 384% of CMHC’s minimum capital target. On the continued strength of our performance, CMHC will be implementing a dividend framework and will begin paying a dividend to the Government of Canada in 2017.
  • CMHC is focussed on becoming a world leader in housing risk management. In 2016, CMHC worked with the Department of Finance to strengthen our housing system through changes to the rules for mortgage loan insurance and supported the development of a lender risk sharing proposal that aims to rebalance risk in the housing finance system.
  • CMHC is committed to transparency and aims to lead through information and insight. In 2016, CMHC expanded its research and analysis activities to provide decision-makers with timely and relevant data about housing in Canada. Information diffusion is a key tactic in developing better ideas; gathering and sharing data and analysis remains a priority for the future.  

Providing support for Canadians in housing need

  • CMHC provides federal funding in support of housing programs so that Canadians in need have access to affordable and suitable housing, including on-reserve. In 2016, in addition to the $2 billion the Government already invests in housing each year, CMHC was entrusted with delivering more than $4 billion in new investments to improve access to affordable housing. CMHC supported over 500,000 Canadian households in housing need through these investments.
  • In 2016, CMHC led consultations with Canadians to inform Canada’s first National Housing Strategy. A summary report of Canadians’ views, ideas and insights was released in November 2016 and identified affordability, sustainability, inclusivity, and improving quality of life as among the most important housing outcomes to address in the Strategy. Reducing core housing need by supporting the development and implementation of the National Housing Strategy in one of CMHC’s main priorities for 2017.

“In 2016, CMHC truly re-emerged as Canada’s authority on housing. We significantly increased our support for Canadians in housing need through renewed investments in affordable housing; we led a national consultation to inform Canada’ first National Housing Strategy all while supporting Canadian’s access to housing finance through our ongoing mortgage loan insurance and securitization activities.” 
Evan Siddall, President and CEO

“The overall quality of our mortgage loan insurance portfolio continued to improve. Combined with our securitization operations, CMHC generated $1.4 billion in net income for the year.”
Wojo Zielonka, Chief Financial Officer and Senior Vice-President, Capital Markets

Read

Housing starts are trending higher at 213,768 units in April 2017, compared to 210,702 units in March 2017, according to Canada Mortgage and Housing Corporation (CMHC). This trend measure is a six-month moving average of the monthly seasonally adjusted annual rates (SAAR) of housing starts.


“New housing construction increased in Canada, with seasonally adjusted data exceeding 200,000 units for five months in a row”, said Bob Dugan, CMHC’s Chief Economist. “The increase in the trend was mainly due to apartment construction in British Columbia and Québec, which was partly offset by a decline in Ontario’s multiple starts.”

Monthly highlights

  • Apartment construction continues to drive the residential market in Halifax. April saw over 400 additional multiple starts breaking ground, bringing year-to-date multiples starts growth to 169% compared to last year. Demand is being driven in part by the ageing population as downsizing baby boomers are increasingly selling their homes and moving into rental units.
  • Even though the rate of housing starts in the Province of Québec was down in April, the total for the first four months was up by about 30% in the province’s urban centres. This result was mainly due to the significant construction of apartments, especially rental units, in the Montréal and Québec areas. As well, single-detached home starts have been strong so far in 2017, thanks in part to tightening resale market conditions.
  • Despite the slight decline registered in April, residential construction in the Gatineau area showed positive results for the first four months of the year. The gains were particularly strong in the rental segment, with construction getting under way on many seniors’ housing units. Overall, starts were supported by an increase in housing demand and a decrease in the number of unsold units on the new and existing home markets.
  • The trend in housing starts in Toronto remained stable in April, as slight increases in low-rise homes were offset by some declines in apartment starts. Overall, new home construction this year has been building momentum as both new single-detached and townhome starts trended higher to reach a nine-year high in April. Tight conditions in the resale market continue to cause demand to spill over into the new home market.
  • In London, April 2017 single-detached starts were much higher than in April 2016 and the ten year average for April. The gap between house prices in Toronto and London has widened significantly, making new single-detached homes in London that much more appealing to retirees from Toronto who wish to sell their home but not downsize.
  • In Winnipeg, a decrease in inventories in the new home market and balanced resale market conditions are allowing builders to increase production. Actual housing starts in April increased year-over-year for the fourth consecutive month, boosting year-to-date starts to their highest levels since 1987.
  • The trend measure for housing starts in the Kelowna CMA surged upwards again in April, due to an increase in both single-detached and multi-unit construction. In particular, a number of large apartment rental projects are now underway as builders continue to respond to the low vacancies that have characterized Kelowna’s rental market for the past two years.
  • Housing starts in Metro Vancouver trended higher for the first time in four months, led by multiple-family residential construction. Builders are responding to demand in the market as eight in ten townhouses and all apartments were sold at completion during the last two months.

CMHC uses the trend measure as a complement to the monthly SAAR of housing starts to account for considerable swings in monthly estimates and obtain a more complete picture of Canada’s housing market. In some situations analyzing only SAAR data can be misleading, as they are largely driven by the multi-unit segment of the market which can vary significantly from one month to the next.


The standalone monthly SAAR of housing starts for all areas in Canada was 214,098 units in April, down from 252,305 units in March. The SAAR of urban starts decreased by 15.3 per cent in April to 199,485 units. Multiple urban starts decreased by 16.7 per cent to 134,314 units in April and single-detached urban starts decreased by 12.1 per cent, to 65,171 units.


Rural starts were estimated at a seasonally adjusted annual rate of 14,613 units.


Preliminary Housing Starts data is also available in English and French through our website and through CMHC’s Housing Market Information Portal. Our analysts are also available to provide further insight into their respective markets.


As Canada’s authority on housing, CMHC contributes to the stability of the housing market and financial system, provides support for Canadians in housing need, and offers objective housing research and information to Canadian governments, consumers and the housing industry.


Provided By: CMHC

Read

Prices in Canada’s most expensive city for existing homes appear to have rebounded from the impact of a tax on foreign buyers as Vancouver realtors reported Tuesday a huge swing in demand for condominiums and townhomes in April.


The Real Estate Board of Greater Vancouver said the composite benchmark price for all residential properties in Metro Vancouver was $941,100 in April, an 11.4 per cent increase from a year ago but a five per cent jump in the past three months.


Sales of all property types dropped 25.7 per cent from a year ago to 3,533 in April but were 4.8 per cent above the 10-year average for the month. Compared to March sales, April activity fell 0.7 per cent.


“Our overall market is operating below the record-setting pace from a year ago and is in line with historical spring levels. It’s a different story in our condominium and townhome markets,” said Jill Oudil, president of the board. “Demand has been increasing for months and supply is not keeping pace. This dynamic is causing prices to increase and making multiple offer scenarios the norm.”


The board said for the first four months of the year, condominiums and townhomes accounted for 68.5 per cent of all residential sales, up from the 58.2 per cent average over the same period last year.


“Until more entry level, or missing middle, homes are available for sale in our market, we’ll likely continue to see prices increase,” Oudil said. “There’s been record building this past year, but much of that inventory isn’t ready to hit the market.”


The Vancouver market has seen sales decline steadily since the province announced an additional 15 per cent tax on foreign buyers effective Aug. 2, 2016. Ontario followed with its own 15 per cent on foreign buyers, calling it a non-resident tax and extending it to the entire Greater Golden Horseshoe which affects a population of about nine million people in southern Ontario.


Doug Porter, the chief economist with Bank of Montreal, said the evidence is clear that the tax in British Columbia did cool Vancouver’s single detached home market. “Vancouver was as hot as a fire cracker in 2016,” said Porter. “It looks the shock of the tax is wearing off. But who knows where prices would have been absent the tax?”


April new listings for detached, attached and apartment properties in Metro Vancouver totalled 4,907, a 19.9 per cent decrease from a year ago but a three per cent increase from March.


The total number of residential properties currently listed for sale in the region were 7,813 in April, a 3.5 per cent increase from a year ago and three per cent bump from a year ago.


“It’s worth pointing out that according to the realtors each (segment) of the market is a seller’s market still,” said Porter, referring to detached, condominium and townhomes.


The sales-to-active listings ratio for April 2017 was 45.5 per cent for all property types, two per cent below March 2017.


“Generally, analysts say that downward pressure on home prices occurs when the ratio dips below the 12 per cent mark for a sustained period, while home prices often experience upward pressure when it surpasses 20 per cent over several months,” said the REBGV.


By property type, the sales-to-active listings ratio was 26 per cent for detached homes, 58.2 per cent for townhomes, and 82.2 per cent for condominiums.


Sales of detached properties dropped 38.8 per cent from a year ago to 1,979 last month. The benchmark price for detached properties was $1,516,500, an 8.1 per cent increase from a year ago and a 1.8 per cent from March 2017.


Sales of apartment, or condominium, properties dropped 18.3 per cent from a year ago to 1,722 while the benchmark price of $554,100 was up 16.6 per cent from a year ago and 3.1 per cent from March.


Attached, or townhome, property sales fell 10.8 per cent in April from a year ago while the benchmark price was $701,800, a 15.3 per cent increase from a year ago and a 2.4 per cent from March.


Toronto numbers are due Wednesday, the first reporting period since it brought in its tax, but Porter doesn’t think Canada’s largest city will have the same reaction.


“I would suggest the tax was a shock in B.C.. I don’t think it was shock in Ontario, there was plenty of warning and hints (it was coming),” said Porter.


Garry Marr

Financial Post

Read

Demand for condominiums and townhomes continues to drive the Metro Vancouver* housing market.


Residential property sales in the region totalled 3,553 in April 2017, a 25.7 per cent decline compared to April 2016 when 4,781 homes sold and a 0.7 per cent decrease from the 3,579 sales recorded in March 2017.


April sales were 4.8 per cent above the 10-year average for the month.


For the first four months of the year, condominium and townhome sales have comprised a larger percentage of all residential sales on the Multiple Listing Service® (MLS®) in Metro Vancouver. Over this time, they’ve accounted for 68.5 per cent, on average, of all residential sales. This is up 10 per cent from the 58.2 per cent average over the same period last year.


“Our overall market is operating below the record-setting pace from a year ago and is in line with historical spring levels. It’s a different story in our condominium and townhome markets," Jill Oudil, Real Estate Board of Greater Vancouver (REBGV) president said. “Demand has been increasing for months and supply is not keeping pace. This dynamic is causing prices to increase and making multiple offer scenarios the norm.”


New listings for detached, attached and apartment properties in Metro Vancouver totalled 4,907 in April 2017. This represents a decrease of 19.9 per cent compared to the 6,127 units listed in April 2016 and a three per cent increase compared to March 2017 when 4,762 properties were listed.


The total number of residential properties currently listed for sale on the MLS® system in Metro Vancouver is 7,813, a 3.5 per cent increase compared to April 2016 (7,550) and a three per cent increase compared to March 2017 (7,586).


The sales-to-active listings ratio for April 2017 is 45.5 per cent for all property types. This is two per cent below March 2017 and is indicative of a sellers’ market. Generally, analysts say that downward pressure on home prices occurs when the ratio dips below the 12 per cent mark for a sustained period, while home prices often experience upward pressure when it surpasses 20 per cent over several months.


By property type, the sales-to-active listings ratio is 26 per cent for detached homes, 58.2 per cent for townhomes, and 82.2 per cent for condominiums.


“Until more entry level, or ‘missing middle’, homes are available for sale in our market, we’ll likely continue to see prices increase,” Oudil said. “There’s been record building this past year, but much of that inventory isn’t ready to hit the market.”


The MLS® Home Price Index composite benchmark price for all residential properties in Metro Vancouver is currently $941,100. This represents a five per cent increase over the past three months and an 11.4 per cent increase compared to April 2016.


Over the last three months, the benchmark price of condominiums has seen the largest increase in the region at 8.2 per cent, followed by townhomes at 5.3 per cent, and detached homes at 2.8 per cent.


“Home buyers are looking to get into the market and they’re facing fierce competition,” Oudil said. “It’s important to work with your local Realtor to help you navigate today’s marketplace.” Sales of detached properties in April 2017 reached 1,211, a decrease of 38.8 per cent from the 1,979 detached sales recorded in April 2016. The benchmark price for detached properties is $1,516,500. This represents an 8.1 per cent increase over the last 12 months and a 1.8 per cent increase compared to March 2017.


Sales of apartment, or condominium, properties reached 1,722 in April 2017, a decrease of 18.3 per cent compared to the 2,107 sales in April 2016.The benchmark price of an apartment property is $554,100. This represents a 16.6 per cent increase over the past 12 months and a 3.1 per cent increase compared to March 2017.


Attached, or townhome, property sales in April 2017 totalled 620, a decrease of 10.8 per cent compared to the 695 sales in April 2016. The benchmark price of an attached unit is $701,800. This represents a 15.3 per cent increase over the past 12 months and a 2.4 per cent increase compared to March 2017.

Read

Over the next five years, the population at Simon Fraser University on Burnaby Mountain is expected to double to 10,000 residents, and campus stakeholders are aiming to tailor the area’s mix of commercial space to meet the needs of the emerging town centre.


Underscoring the growth at SFU was the recent announcement by the B.C. government, Burnaby school district and SFU stakeholders to jointly fund another 195 new spaces at the University Highlands Elementary School to the tune of $3.9 million, according to a news release sent out by the SFU Community Trust in March.

Another deal is nearing completion to build a 15,000-square-foot medical centre in the community, said Gordon Harris, the president and CEO of the SFU Community Trust.


“That is certainly a missing ingredient,” Harris told The Sun in an interview. He said the community trust operates as a subsidiary to SFU with a mandate to develop and maintain the residential and commercial properties next to SFU campus, called UniverCity.


While the current business mix appears to meet the needs of the community, Harris and the student government say more diverse services, restaurants and shops will be needed as the population increases.


There are currently about 5,000 residents living in the UniverCity neighbourhood — a looping district next to campus with a mix of mid-rise and low-rise condos, townhomes and commercial buildings.


“That puts us at the halfway mark,” he said. “When we’re all done, we’ll be somewhere between 9,000 and 10,000 people.”


There are about 1,300 homes in the UniverCity neighbourhood, but Harris said that will climb to roughly 4,500 by 2022.


He said about 40 per cent of the residents in the neighbourhood either study or work at SFU. “The balance … are living there simply because that’s a choice they’ve made to live in a really interesting, vibrant community beside the campus.”


Harris said the proceeds of their residential and commercial developments flow back to SFU and the university’s foundation as an endowment that is used for teaching and research.


The commercial components of the community are clustered along a two-block stretch called University High Street, with three mixed-use buildings that include a 23,000 sq. ft. grocery store, a B.C. Liquor store, restaurants, fast food and office space.


“We’re trying to create a full range of food convenience-type merchandise to serve the local community, but also to serve the university population,” Harris said, noting that about 25,000 people populate the campus on a daily basis.


As currently designed and leased, there seems to be a decent mix of food and retail to meet students’ needs, said Larissa Chen, the president of the Simon Fraser Student Society. 


“There is definitely a lot of growth and a lot of buildings being built,” Chen said, stressing that many students rely on the food services emerging along the University High Street in addition to the food available on campus proper.


One pressing need is more banking options, said Chen, who has previously lived in the UniverCity neighbourhood. “We only have one bank on campus. … That was a barrier for a lot of student groups,” she said.


“We are quite displaced from the rest of Burnaby, so it’s very interesting to see how a little community has been built on the mountain where you are able to access your basic needs,” she said. “I think, personally, there could be more, because people always enjoy options.”


Vancouver-based Macdonald Commercial Realty handles the leasing and management of the commercial buildings, which remain under the SFU Community Trust’s ownership.


The High Street area really came to life in 2009 with the opening of Nesters Market, said Tony Letvinchuk, Macdonald Commercial’s managing director.


There are currently three core mixed-use buildings in the area, including the fully leased Hub, home to Nesters, the nearly full 43,000-sq.-ft. Cornerstone building, and the new CentreBlock building, which is now leasing about 33,000 sq. ft. of commercial space on two floors.


The opening of CentreBlock this year across the street from Nesters Market boosted services, Letvinchuk said, listing A&W, Chef Hung Restaurant, Uncle Fatih’s Pizza, Migoto Sushi and Chopped Leaf among their initial leases.


“The Hub and Cornerstone buildings on University High Street are now virtually 100 per cent occupied, with a B.C. government liquor store opening their doors last year and Starbucks operating a prime location in Cornerstone since the fall of 2015,” said Barb Burrows, the leasing agent for the building for Macdonald.

The Terry Fox Foundation headquarters is also located in the Cornerstone Building, she said.


Harris said there are also plans underway to add a fourth mixed-use commercial building to the area.

The building could help to fill in the commercial gaps in coming years, he said. “We think that as the community grows and matures, there’s a need for another restaurant, and when we get that restaurant, we’d like for it to be a little more upscale,” he said.


He said more diverse retail, including apparel and other supplies, could also be on the horizon. “We’re not there yet, but we think in the next five years we could be.”


Provided BY:

evan@evanduggan.com

twitter.com/EvanBDuggan

Read

The B.C. government unveiled a foreign-buyer’s tax last summer aimed at tamping down Vancouver’s runaway real estate market and making homes more affordable.


Eight months later, has home affordability actually improved?


Vancouver-area sales, listings and prices all dropped after the measure – a 15-per-cent property transfer tax on foreign national home buyers – went into effect Aug. 2.


But by then, the market was already cooling, Royal Bank of Canada senior economist Robert Hogue said last week in a report.


“The impact of the tax in Metro Vancouver was more evident on housing prices and purchases by foreign nationals than on home resale activity, which had been slowing for several months before the tax was even announced,” he wrote.


Indeed, prices took a step back for several consecutive months.


But while sales and new listings are still sharply lower from a year ago, prices have recently gone back on the upswing and now sit close to record levels. 


Two measures of home affordability suggest the situation in Vancouver has yet to make any significant improvements – and in some instances, might even be worsening.


Detached-home ownership costs still outstrip household income in Greater Vancouver, figures from RBC Economics show.


For the fourth quarter of last year, ownership costs for an average-priced detached home amounted to 121 per cent of median pre-tax household income, a slight improvement from the previous two quarters. But the easing may be short-lived with prices back on the rise. 


RBC’s affordability measure is based on a 25-per-cent down payment with a 25-year mortgage loan at a five-year fixed rate, and ownership costs include mortgage payments, property taxes and utilities.


Greater Vancouver’s aggregate measure was 84.8 per cent, “which clearly indicates that owning a home at current market prices – especially a single-detached home – is still out of reach for a typical area household,” RBC said in a March report. 


Separately, economists at National Bank Financial have tallied the length of time needed to save for a minimum down payment in various Canadian cities.


On this measure, the situation in Vancouver is bleaker than ever.


It would take a median-income household 428 months – or nearly 36 years – to save for a down payment on a non-condo dwelling (detached or row housing), first-quarter figures show. Going back to 1990, this measure has never been higher and compares with a national savings timeline of 40 months. (NBF’s calculation assumes a household saving 10 per cent of its pre-tax income for a median-priced dwelling.) 


Why the big spike at the outset of 2016?


Because the median price jumped beyond the $1-million mark. Above that threshold, buyers are required to put down at least 20 per cent of the home’s purchase price. Below that mark, buyers can get into the market with a lower down payment, provided they take on default insurance.


As Ontario implements its own foreign-buyer’s tax – the province last week unveiled a “nonresident speculation tax” as part of its 16-point plan for housing reform – the aftermath in Vancouver would suggest there are no quick fixes in markedly improving affordability


The Globe and Mail


Read
Reciprocity Logo The data relating to real estate on this website comes in part from the MLS® Reciprocity program of either the Greater Vancouver REALTORS® (GVR), the Fraser Valley Real Estate Board (FVREB) or the Chilliwack and District Real Estate Board (CADREB). Real estate listings held by participating real estate firms are marked with the MLS® logo and detailed information about the listing includes the name of the listing agent. This representation is based in whole or part on data generated by either the GVR, the FVREB or the CADREB which assumes no responsibility for its accuracy. The materials contained on this page may not be reproduced without the express written consent of either the GVR, the FVREB or the CADREB.