RSS

Back On The Market - New Price: 303 1155 The High St., Coquitlam; North Coquitlam

Stunning 2 Level Home

1000+sqft of Outdoor Space

Priced at $948,800


click here for more info...


Luxurious living! Perfect for downsizer or someone looking for a spacious home. Located in concrete built M One of North Coquitlam, close to all amenities, Skytrain, all lvls of schools & much more. Don't miss this one! Quality shows through this 1332sqft/2bed+den/3bath/2lvl/3rd story townhome style condo w/1000+sqft of outdoor living oasis. Main: tons of natural light, gourmet kitchen w/high end apps, island, granite counters, plenty of storage, 2pc pwdr, living, dinning & family rms & 4 entries to patio. Up: master w/large fully organized closet, 3pc bath & balcony. 2nd bed has custom Murphy bed, den w/built shelving, 4pc bath & full-size W/D complete this lvl. Bonus: 2 parking & 5 lockers. Act Now! 
Read

The British Columbia Real Estate Association (BCREA) reports that a total of 7,884 residential unit sales were recorded by the Multiple Listing Service® (MLS®) across the province in June, a 32.5 per cent decrease from the same month last year. The average MLS® residential price in BC was $716,326, down 1.3 per cent from June 2017. Total sales dollar volume was $5.6 billion, a 33 per cent decline from June 2017.

“The impact of the B20 stress test is still being felt across the province,” said Brendon Ogmundson, BCREA Deputy Chief Economist. “Lower demand as the result of higher mortgage rates and stringent mortgage qualification rules are bringing most markets around the province back into balanced conditions.”

Although the supply of active listings in the province is on the rise, inventory remains low by historical standards and markets like Vancouver Island and the Okanagan remain undersupplied.

Year-to-date, BC residential sales dollar volume was down 18 per cent to $32 billion, compared with the same period in 2017. Residential unit sales decreased 20 per cent to 43,863 units, while the average MLS® residential price was up 2.4 per cent to $730,492.


June 2018 Residential Average Price, Active Listings and Sales-to-Active-Listings Data by Board


Board

Average Price

Active Listings

Sales-to-Active-Listings

June 2018 Residential Average Price

($)

June 2017 Residential Average Price

($)

%

change

June 2018 Residential Active Listings

(Units)

June 2017 Residential Active Listings

(Units)


% change

June 2018 Residential Sales to Active

Listings (%)

June 2017 Residential Sales to Active

Listings (%)

BC Northern

310,569

289,833

7.2

2,338

2,729

-14.3

20.7

19.8

Chilliwack

529,157

488,108

8.4

1,347

956

40.9

21.5

50.4

Fraser Valley

753,729

745,997

1

5,880

4,255

38.2

23.5

58

Greater Vancouver

1,068,559

1,053,655

1.4

12,652

9,198

37.6

19.5

43

Kamloops

391,667

373,670

4.8

1,198

1,284

-6.7

27.4

29

Kootenay

339,028

332,114

2.1

1,990

2,280

-12.7

15.8

18.2

Okanagan Mainline

547,485

511,242

7.1

4,111

3,371

22

19.4

30.2

Powell River

336,142

329,896

1.9

139

105

32.4

23

58.1

South Okanagan

442,384

416,343

6.3

1,127

972

15.9

20.2

29.6

Northern Lights

274,966

294,967

-6.8

462

473

-2.3

9.5

8.9

Vancouver Island

473,219

442,155

7

2,691

2,630

2.3

31.2

40.7

Victoria

699,257

674,952

3.6

1,997

1,398

42.8

34

68.8

Provincial Totals*

716,326

725,748

-1.3

35,932

29,651

21.2

21.9

39.4

*Numbers may not add due to rounding

Click here for more....


Provided by: BCREA

Read

The trend in housing starts was 222,041 units in June 2018, compared to 216,701 units in May 2018, according to Canada Mortgage and Housing Corporation (CMHC). This trend measure is a six-month moving average of the monthly seasonally adjusted annual rates (SAAR) of housing starts.


"The national trend in housing starts increased in June, reflecting a jump in the SAAR of multi-unit dwellings in urban centres in June to a historical high," said Bob Dugan, CMHC's chief economist. "Notably, the national inventory of newly completed and unabsorbed multi-unit dwellings has remained below its 10-year historical average so far in 2018, indicating that demand for this type of unit has absorbed increased supply."

Monthly highlights

Vancouver

Housing starts trended lower in June 2018 as fewer multi-family projects got underway during the month. For the first half of 2018, total housing starts matched the level of activity in the same period in 2017. Particularly high home prices and strong demand from a growing population so far in 2018 have incentivized some new supply, maintaining an elevated pace of new home construction in the Vancouver Census Metropolitan Area (CMA).

Victoria

Metro Victoria housing starts reached mid-year 45% ahead of 2017 levels, driven by substantially higher multi starts. Rental starts were double the rate seen in the first half of 2017 in response to low vacancy rates. Elsewhere, relatively more affordable housing types dominated construction. Condo construction was nearly 60% higher due to the relative affordability of condos over single detached units, which were down 15%. The generally lower average prices in Langford coincided with 44% of all construction in the metro area. Ground-oriented, freehold multi-unit construction was also up 41%, pointing to densification.

Calgary

June housing starts were down in Calgary year-over-year, but year-to-date (YTD) there has been 8% growth over 2017. Single-detached units were on par with the previous year, while there were roughly half as many rental units initiated. The growth in total housing starts has been driven by the condo market. Condo starts grew 36% YTD over 2017.

Winnipeg

The trend measure of housing starts declined further in June after the pace of both single-detached and multi-family starts slowed from the previous month. Following a strong performance in 2017, total housing starts in the Winnipeg CMA continued to moderate during the first half of 2018, down 32% from a year earlier. The decline was most pronounced in the multiples sector where production through June 2018 declined by 38% from the same period of 2017.

Province of Québec

For the first six months of the year, the relatively strong rate of residential construction in Quebec is attributable to the apartment market segment, including rental and condominium. Favourable economic conditions, decreasing supply in the resale market and population aging have all contributed to increased housing starts.

Kingston

Housing starts in Kingston trended higher in June as more multi-unit housing starts, including starts of rental apartments, got underway. Builders have started rental projects in four out of the last six months reflecting a very low vacancy rate, which stood at 0.7% in fall 2017, the lowest among 16 Ontario CMAs.

Toronto

Primarily led by apartment starts, the total number of housing starts in the Toronto CMA trended up to reach a near two year high in June. Driven by condominium apartment starts which recorded a 30 year high for the month. The majority of these apartment starts were spread evenly across the City of Toronto, Mississauga, and Vaughan, highlighting the broad spread of high rise construction in the Toronto CMA.

Hamilton

Apartment starts increased in June, causing overall housing starts to trend up. Apartment starts have reached a very high level in Hamilton due to strong demand from first-time buyers, downsizers, and rental property investors. Faced with fewer options in the resale market at their price point, more first-time buyers and downsizers have purchased new condominium apartments. Rental property investors are looking to take advantage of the extremely low vacancy rates in the region.

St. Catharines

Total housing starts in the St. Catharines CMA trended slightly lower in June. Nevertheless, they were nearly 50% above the ten year average. The mild slowdown was generated by the single-detached sector, while all multi-family housing types saw increases this month. Stronger migration flows from other parts of Ontario continue to fuel demand for new homes in the area.

Kitchener-Cambridge-Waterloo

Total housing starts trended upwards in the Kitchener-Cambridge-Waterloo CMA for the first time in the past five months. While row starts continued trending downwards, marginal increase in single-detached starts was able to pull total starts higher. The slight pickup in full-time employment and tightening resale market conditions during late 2017 supported spillover demand for single-detached units from the resale market to the new construction market.

Halifax

After a slow start to 2018, multiples construction in Halifax picked up pace in June, the strongest month so far this year. While levels of construction remain strong on the Halifax Peninsula, the majority of new apartments starts this year have been located in the suburban market. Construction on the single-detached market remains elevated, recording a year-to-date growth of 10% compared to the same period last year.

CMHC uses the trend measure as a complement to the monthly SAAR of housing starts to account for considerable swings in monthly estimates and obtain a more complete picture of Canada’s housing market. In some situations analyzing only SAAR data can be misleading, as they are largely driven by the multi-unit segment of the market which can vary significantly from one month to the next.

The standalone monthly SAAR of housing starts for all areas in Canada was 248,138 units in June, up from 193,902 units in May. The SAAR of urban starts increased by 29.9% in June to 228,844 units. Multiple urban starts increased by 46.4% to 172,845 units in June while single-detached urban starts decreased by 3.5% to 55,999 units.

Rural starts were estimated at a seasonally adjusted annual rate of 19,294 units.


Preliminary Housing Start Data in Centres 10,000 Population and Over
  Single-DetachedAll OthersTotal
June 2017 June 2018 % June 2017 June 2018 % June 2017 June 2018 %
Provinces (10,000+)  
N.-L. 71 82 15 43 10 -77 114 92 -19
P.E.I. 29 31 7 77 42 -45 106 73 -31
N.S. 147 184 25 53 324 ## 200 508 154
N.B. 106 121 14 63 170 170 169 291 72
Atlantic 353 418 18 236 546 131 589 964 64
Qc 740 804 9 2,708 4,061 50 3,448 4,865 41
Ont. 3,115 2,355 -24 4,173 6,871 65 7,288 9,226 27
Man. 259 209 -19 271 282 4 530 491 -7
Sask. 204 134 -34 210 102 -51 414 236 -43
Alta. 1,277 1,032 -19 1,336 1,176 -12 2,613 2,208 -15
Prairies 1,740 1,375 -21 1,817 1,560 -14 3,557 2,935 -17
B.C. 1,004 908 -10 2,274 2,055 -10 3,278 2,963 -10
Canada (10,000+) 6,952 5,860 -16 11,208 15,093 35 18,160 20,953 15
Metropolitan Areas                  
Abbotsford-Mission 34 31 -9 233 16 -93 267 47 -82
Barrie 125 40 -68 86 254 195 211 294 39
Belleville 48 51 6 2 6 200 50 57 14
Brantford 4 58 ## 45 4 -91 49 62 27
Calgary 445 360 -19 945 707 -25 1,390 1,067 -23
Edmonton 570 475 -17 261 387 48 831 862 4
Greater Sudbury 17 26 53 14 11 -21 31 37 19
Guelph 31 29 -6 29 78 169 60 107 78
Halifax 98 110 12 12 281 ## 110 391 255
Hamilton 101 48 -52 105 498 374 206 546 165
Kelowna 77 91 18 134 210 57 211 301 43
Kingston 39 47 21 201 180 -10 240 227 -5
Kitchener-Cambridge-Waterloo 93 94 1 134 203 51 227 297 31
Lethbridge 41 33 -20 17 13 -24 58 46 -21
London 229 130 -43 336 480 43 565 610 8
Moncton 42 37 -12 30 58 93 72 95 32
Montréal 314 328 4 1,121 2,484 122 1,435 2,812 96
Oshawa 160 214 34 438 129 -71 598 343 -43
Ottawa-Gatineau 319 367 15 400 812 103 719 1,179 64
Gatineau 8 25 213 73 204 179 81 229 183
Ottawa 311 342 10 327 608 86 638 950 49
Peterborough 43 54 26 11 5 -55 54 59 9
Québec 107 95 -11 1,118 812 -27 1,225 907 -26
Regina 68 37 -46 117 41 -65 185 78 -58
Saguenay 18 37 106 8 22 175 26 59 127
St. Catharines-Niagara 124 60 -52 84 87 4 208 147 -29
Saint John 20 33 65 0 0 - 20 33 65
St. John's 51 66 29 39 7 -82 90 73 -19
Saskatoon 119 88 -26 79 43 -46 198 131 -34
Sherbrooke 59 51 -14 46 114 148 105 165 57
Thunder Bay 21 22 5 24 8 -67 45 30 -33
Toronto 1,059 600 -43 2,108 4,116 95 3,167 4,716 49
Trois-Rivières 31 25 -19 31 42 35 62 67 8
Vancouver 457 422 -8 1,585 1,045 -34 2,042 1,467 -28
Victoria 85 94 11 194 418 115 279 512 84
Windsor 108 73 -32 50 23 -54 158 96 -39
Winnipeg 231 167 -28 265 239 -10 496 406 -18
Total 5,388 4,493 -17 10,302 13,833 34 15,690 18,326 17

Data for 2017 based on 2016 Census Definitions.
Data for 2018 based on 2016 Census Definitions.
Source: Market Analysis Centre, CMHC

## not calculable/extreme value

Preliminary Housing Start Data — Seasonally Adjusted at Annual Rates (SAAR)
  Single-DetachedAll OthersTotal
May 2018 June 2018 % May 2018 June 2018 % May 2018 June 2018 %
Provinces (10,000+)  
N.L. 374 659 76 138 120 -13 512 779 52
P.E.I. 277 274 -1 216 504 133 493 778 58
N.S. 1,302 1,534 18 2,032 3,917 93 3,334 5,451 63
N.B. 729 802 10 879 1,879 114 1,608 2,681 67
Qc 6,448 6,672 3 27,338 44,299 62 33,786 50,971 51
Ont. 23,145 21,455 -7 29,201 79,361 172 52,346 100,816 93
Man. 2,627 2,318 -12 2,580 3,384 31 5,207 5,702 10
Sask. 1,204 1,252 4 2,676 1,224 -54 3,880 2,476 -36
Alta. 12,627 11,313 -10 21,765 13,594 -38 34,392 24,907 -28
B.C. 9,314 9,720 4 31,270 24,563 -21 40,584 34,283 -16
Canada (10,000+) 58,047 55,999 -4 118,095 172,845 46 176,142 228,844 30
Canada (All Areas) 70,389 69,082 -2 123,514 179,057 45 193,902 248,138 28
Metropolitan Areas                  
Abbotsford-Mission 253 323 28 288 192 -33 541 515 -5
Barrie 458 249 -46 1,692 3,048 80 2,150 3,297 53
Belleville 310 452 46 636 72 -89 946 524 -45
Brantford 442 757 71 720 48 -93 1,162 805 -31
Calgary 4,790 4,079 -15 15,180 8,484 -44 19,970 12,563 -37
Edmonton 5,739 5,093 -11 5,424 4,644 -14 11,163 9,737 -13
Greater Sudbury 41 177 332 96 132 38 137 309 126
Guelph 155 188 21 96 936 ## 251 1,124 348
Halifax 487 897 84 1,644 3,372 105 2,131 4,269 100
Hamilton 478 444 -7 4,284 5,976 39 4,762 6,420 35
Kelowna 844 1,074 27 2,964 2,520 -15 3,808 3,594 -6
Kingston 313 351 12 240 2,160 ## 553 2,511 354
Kitchener-Cambridge-Waterloo 1,021 871 -15 1,044 2,436 133 2,065 3,307 60
Lethbridge 450 389 -14 288 156 -46 738 545 -26
London 1,526 1,033 -32 516 5,760 ## 2,042 6,793 233
Moncton 160 232 45 324 696 115 484 928 92
Montréal 2,815 2,832 1 17,583 29,594 68 20,398 32,426 59
Oshawa 1,583 1,513 -4 696 1,548 122 2,279 3,061 34
Ottawa-Gatineau 2,986 2,913 -2 5,832 9,744 67 8,818 12,657 44
Gatineau 460 275 -40 2,148 2,448 14 2,608 2,723 4
Ottawa 2,526 2,638 4 3,684 7,296 98 6,210 9,934 60
Peterborough 379 362 -4 288 60 -79 667 422 -37
Québec 691 791 14 5,364 9,744 82 6,055 10,535 74
Regina 421 321 -24 828 492 -41 1,249 813 -35
Saguenay 176 247 40 240 264 10 416 511 23
St. Catharines-Niagara 655 631 -4 720 1,044 45 1,375 1,675 22
Saint John 168 206 23 0 0 - 168 206 23
St. John's 249 538 116 108 84 -22 357 622 74
Saskatoon 643 785 22 1,728 516 -70 2,371 1,301 -45
Sherbrooke 256 266 4 1,512 1,368 -10 1,768 1,634 -8
Thunder Bay 59 114 93 0 96 ## 59 210 256
Toronto 8,507 6,274 -26 14,904 49,392 231 23,411 55,666 138
Trois-Rivières 304 165 -46 360 504 40 664 669 1
Vancouver 4,288 4,450 4 22,272 12,540 -44 26,560 16,990 -36
Victoria 1,097 956 -13 2,124 5,016 136 3,221 5,972 85
Windsor 586 531 -9 432 276 -36 1,018 807 -21
Winnipeg 1,994 1,773 -11 2,484 2,868 15 4,478 4,641 4


Provided by: CMHC

Read

Just Listed: 277 Mundy St., Coquitlam, Coquitlam East

Private Elevator

Quality Workmanship & Finishing

Priced at $2,298,800

Open: July 14 & 15 from 2 to 4


Click here for more details....


Wait...Did you say ELEVATOR? Yup, you read that right! Stunning 8bed+/8bath/5915sqft/3lvl home on an 8500sqft lot; perfect for a multi-generational family. Features: 9' ceilings, engineered & tile floors, formal living & dining rms, large gourmet kitchen, spice kitchen, dble height ceilings in great rm, well-sized yard & covered patio w/gas. Convenient main lvl guest rm, 4pc, mud rm, & 1 car garage. Up: Catwalk-style layout open to the great rm: a spacious master, walk-in & 5pc ensuite on one side & 3 well sized rms w/ensuites on the other. Down: huge rec. rm, home theater, wet bar, hot tub, pool table, bedrm & 4pc bath. Bonus: large 2 car detached garage & 2 bed legal suite w/separate parking. Act Now! OPEN July 14 & 15 from 2-4 pm.

Read

Just Sold: 306 4160 Albert St., Burnaby North, Vancouver Heights

Completely Renovated

Price at $598,000


 Click here for more details....


Absolutely Stunning! Completely renovated. Nothing to do but move right in. You won't be disappointed. Awaits you is a bright south facing 845sqft/1bed/1bath concrete constructed home in popular Carlton Terrace of Vancouver Heights. Fresh, modern & clean. Brand new: wide plank laminate floors, ceramic tiles, kitchen cupboards, quartz counters, SS apps, blinds, all fixtures, door handles & hinges, paint & W/D. Redone bathroom w/vanity, quartz counters, tub-surround & new aqua drywall. Enjoy the huge master w/loads of closet space & direct access to a covered 138sqft balcony. Bonus: in-suite storage, 1 parking & locker. Close to: schools, transit, rec & all types of amenities. Act Now!

Read

Home seller supply grows as demand declines

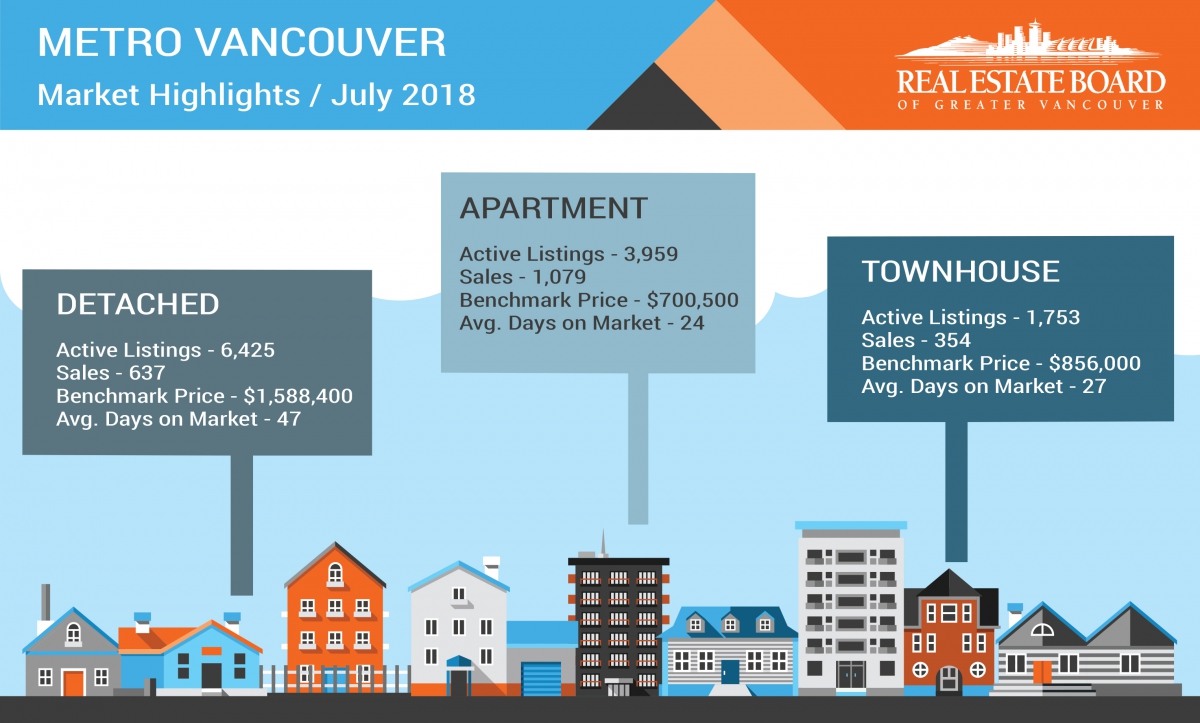
With home sale activity dipping below long-term historical averages, the supply of homes for sale in Metro Vancouver* reached a three-year high in June.


The Real Estate Board of Greater Vancouver (REBGV) reports that residential home sales in the region totalled 2,425 in June 2018, a 37.7 per cent decline from the 3,893 sales recorded in June 2017, and a 14.4 per cent decrease compared to May 2018 when 2,833 homes sold.


Last month’s sales were 28.7 per cent below the 10-year June sales average.


“Buyers are less active today. This is allowing the supply of homes for sale to accumulate to levels we haven’t seen in the last few years,” Phil Moore, REBGV president said. “Rising interest rates, high prices and more restrictive mortgage requirements are among the factors dampening home buyer activity today.”


There were 5,279 detached, attached and apartment properties newly listed for sale on the Multiple Listing Service® (MLS®) in Metro Vancouver in June 2018. This represents a 7.7 per cent decrease compared to the 5,721 homes listed in June 2017 and a 17.2 per cent decrease compared to May 2018 when 6,375 homes were listed.


The total number of homes currently listed for sale on the MLS® system in Metro Vancouver is 11,947, a 40.3 per cent increase compared to June 2017 (8,515) and a 5.8 per cent increase compared to May 2018 (11,292). This is the highest this total has been since June 2015.


“With reduced demand, detached homes are entering a buyers’ market and price growth in our townhome and apartment markets is showing signs of decelerating.”


For all property types, the sales-to-active listings ratio for June 2018 is 20.3 per cent. By property type, the ratio is 11.7 per cent for detached homes, 24.9 per cent for townhomes, and 33.4 per cent for condominiums.


Generally, analysts say that downward pressure on home prices occurs when the ratio dips below the 12 per cent mark for a sustained period, while home prices often experience upward pressure when it surpasses 20 per cent over several months.


The MLS® Home Price Index composite benchmark price for all residential properties in Metro Vancouver is currently $1,093,600. This represents a 9.5 per cent increase over June 2017 and is virtually unchanged from May 2018.


Sales of detached homes in June 2018 reached 766, a 42 per cent decrease from the 1,320 detached sales recorded in June 2017. The benchmark price for a detached home is $1,598,200. This represents a 0.7 per cent increase from June 2017 and a 0.6 per cent decrease compared to May 2018.


Sales of apartment homes reached 1,240 in June 2018, a 34.9 per cent decrease compared to the 1,905 sales in June 2017. The benchmark price for an apartment is $704,200. This represents a 17.2 per cent increase from June 2017 and a 0.4 per cent increase compared to May 2018.


Attached home sales in June 2018 totalled 419, a 37.3 per cent decrease compared to the 668 sales in June 2017. The benchmark price of an attached home is $859,800. This represents a 15.3 per cent increase from June 2017 and is virtually unchanged from May 2018.


Click here for all the stats...


Provided BY: Real Estate Board of Greater Vancouver - REBGV

Read

New real estate rules mean new forms to sign

New real estate rules came into effect that change how REALTORS® and their clients can work together in different circumstances.


These rules state that real estate licensees across our province can now only represent one party in a transaction and must provide additional documentation about representation and compensation.


So, the next time you go to buy or sell a property, your Realtor is required by the government to go through some additional forms to explain how or whether you’re being represented and to clarify the compensation that you’ll pay. Of course, Realtors can still give factual information about the properties they list for sale without providing you with this additional documentation. This, however, would change if you wanted to ask them for advice or to reveal any personal information, e.g. your situation; what you’d like to buy or sell, why; etc. 


There may also be times under the new rules when your Realtor is unable to represent you because they’re already representing another client in the transaction. In these situations, there are some options you can consider, and a Realtor would be happy to explain them to you.


“These new rules and forms change processes and documentation that have been in place in our province for decades. Our more than 14,000 Realtor members are working hard to comply with these regulatory changes,” Phil Moore, Real Estate Board of Greater Vancouver president said. “We ask for the public’s patience during this adjustment period. The new forms and disclaimers are required government changes and we’re doing our best to comply with them while serving your needs.” 


To understand how these new rules could apply to you in your next real estate transaction, talk with your Realtor or refer to the Real Estate Council of BC’s website at www.recbc.ca


Click here to learn more about the new real estate rules. 


Provided By: REBGV

Read

Mortgage Rate Outlook

The Canadian mortgage market has seen substantial changes in the first six months of 2018, with mortgage credit both more expensive and more difficult to access. The B20 stress test for conventional borrowers has slowed overall mortgage credit growth while the five-year qualifying rate for Canadian mortgages has gone up 70 basis points in the past year. Rising mortgage rates have largely been influenced by tighter monetary policy  from the Bank of Canada as strong economic growth has fueled rising inflation.


It has been quite some time since Canada was in a true rising interest rate environment. The last cycle of prolonged rate increases was from 2004 to 2007, just prior to the global financial crisis , when the Bank of Canada increased its overnight policy rate ten times over three years. Much about the Canadian economy has changed since that time, and those changes have had substantial implications for the ultimate destination of Canadian interest rates. The Canadian workforce has aged, lowering the growth rate of the Canadian labour force. Further, the sharp decline in commodity prices has meant a scaling back in oil-sector capital investment and subsequent lower productivity growth. Both of these factors have translated into a lower potential, or long-run, rate of economic growth in Canada. That potential growth, in turn, influences the long-run level of interest rates that the Bank of Canada would like to return to once the economy is at full capacity and inflation is at its 2 per cent target. Ultimately, a lower potential growth rate means lower interest rates in the long-run. The Bank of Canada estimates the long-run level  of its policy rate at 3 to 3.5 per cent.


Based on historical averages of interest rate spreads, that implies that the five-year qualifying rate would equal between 6 and 6.5 per cent once the Bank of Canada closes the gap between the overnight rate and the Bank’s longrun or equilibrium overnight rate. Based on our outlook for Canadian economic growth and inflation, it is likely we will see the five-year qualifying rate near that destination by the end of 2020. 


Economic Outlook

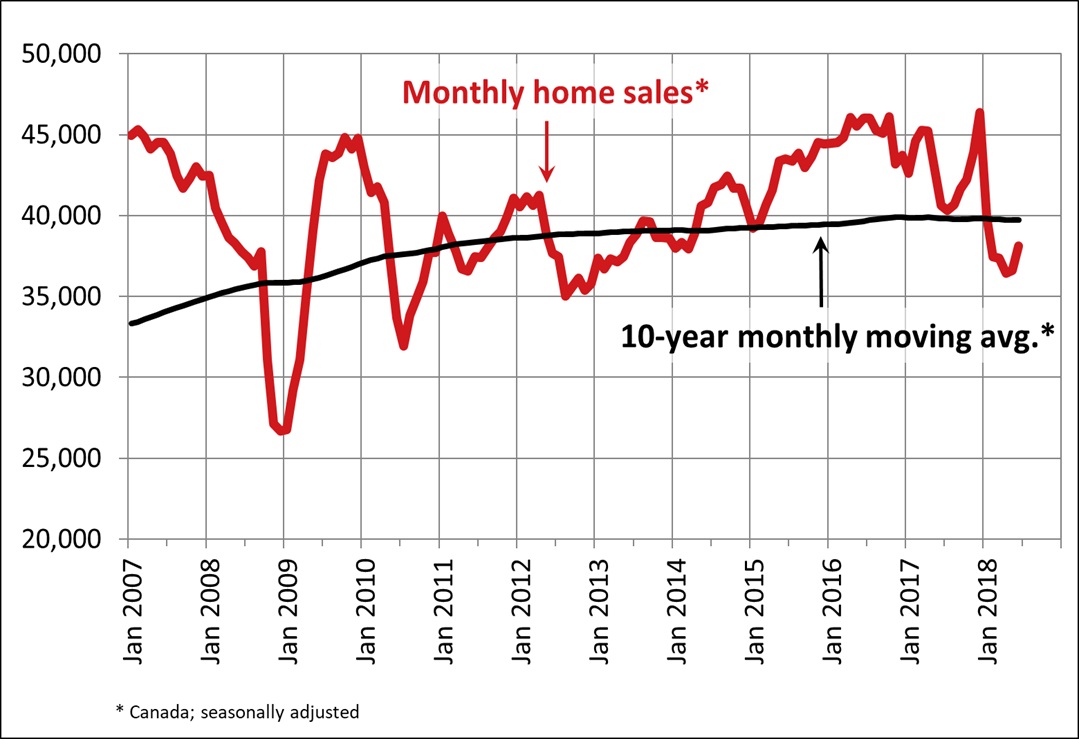
It was a disappointing start to the year for the Canadian economy as first quarter growth came in at just 1.3 per cent, well below the consensus forecast of 2 per cent. Much of the observed weakness can be traced back to the impact of newly implemented mortgage stress tests, which force conventional mortgage borrowers, including those with more than 20 per cent down payment, to qualify at the greater of the five-year fixed qualifying rate or their own contract rate plus 2 per cent. These more stringent qualifying requirements have eroded as much as 20 per cent of would-be buyers’ purchasing power. Not surprisingly, that policy has blunted housing activity across Canada.


If the impact of the stress test evolves in a similar fashion to past macroprudential tightening, we expect that home sales and the wider Canadian economy will rebound in the second half of the year. Our forecast is for Canadian real GDP growth to accelerate over the next three quarters, registering 2.3 per cent for 2018 and 2.0 per cent in 2019. Above-trend economic growth will continue to put pressure on core inflation, which we forecast will rise slightly above 2 per cent over the next year.


It was a disappointing start to the year for the Canadian economy as first quarter growth came in at just 1.3 per cent, well below the consensus forecast of 2 per cent. Much of the observed weakness can be traced back to the impact of newly implemented mortgage stress tests, which force conventional mortgage borrowers, including those with more than 20 per cent down payment, to qualify at the greater of the five-year fixed qualifying rate or their own contract rate plus 2 per cent. These more stringent qualifying requirements have eroded as much as 20 per cent of would-be buyers’ purchasing power. Not surprisingly, that policy has blunted housing activity across Canada.


If the impact of the stress test evolves in a similar fashion to past macroprudential tightening, we expect that home sales and the wider Canadian economy will rebound in the second half of the year. Our forecast is for Canadian real GDP growth to accelerate over the next three quarters, registering 2.3 per cent for 2018 and 2.0 per cent in 2019. Above-trend economic growth will continue to put pressure on core inflation, which we forecast will rise slightly above 2 per cent over the next year.


Interest Rate Outlook
Although the Bank chose to hold its policy rate steady at its May 30 meeting, it did strongly signal that rates are heading higher and soon. To understand why, it is worth reviewing how central banks think about monetary policy. Most central banks set interest rates such that inflation stays at or near its target, which is 2 percent for the Bank of Canada, and the economy runs neither too hot nor too cold. The Bank of Canada measures the temperature of the economy based on the output gap, or the difference between actual real GDP and its estimate of the economy’s potential or long-run trend level. If, as is the case now, that inflation is at target and the economy has returned to its long-run trend, the Bank endeavors to return interest rates back to their long-run or equilibrium level. Given the current policy rate of 1.25 per cent, there is currently a 200-basis point gap between the Bank’s policy rate and the Bank’s preferred long-run level.


However, US trade policy remains a wildcard that may interfere with the Bank’s best laid plans. With a normally functioning international trade negotiation, we would expect the Bank to raise its overnight rate at least one more time this year, possibly as soon as its July meeting. However, the potentially negative economic impact of new tariffs or other trade disruptions could very well delay further rate hikes this year.


Click Link for more....


Provided By: BCREA

Read

Commercial real estate sales in the Lower Mainland declined in the first quarter (Q1) of 2018 compared to the active market experienced in the region last year.


There were 523 commercial real estate sales in the Lower Mainland in Q1 2018, a 10.8 per cent decrease over the 586 sales in Q1 2017, according to data from Commercial Edge, a commercial real estate system operated by the Real Estate Board of Greater Vancouver (REBGV).


The total dollar value of commercial real estate sales in the Lower Mainland was $3.031 billion in Q1 2018, a 38.5 per cent decrease from the $4.927 billion in Q1 2017.


“Our commercial market returned to more historically normal levels in the first quarter of the year compared to the heightened activity we experienced in 2017,” Phil Moore, REBGV president said. “This shift to moretypical activity is mirroring the overall economic trends we’re seeing in our province today.”


Q1 2018 activity by category


Land:

There were 221 commercial land sales in Q1 2018, which is a 3.9 per cent decrease from the 230 land sales in Q1 2017. The dollar value of land sales was $1.594 billion in Q1 2018, a 20.5 per cent decrease from $2.005 billion in Q1 2017.


Office and Retail:

There were 173 office and retail sales in the Lower Mainland in Q1 2018, which is down 15.6 per cent from the 205 sales in Q1 2017. The dollar value of office and retail sales was $1.076 billion in Q1 2018, a 51.8 per cent decrease from $2.232 billion in Q1 2017.


Industrial:

There were 113 industrial land sales in the Lower Mainland in Q1 2018, which is down 7.4 per cent from the 122 sales in Q1 2017. The dollar value of industrial sales was $0.280 billion in Q1 2018, a 12.2 per cent increase over $0.250 billion in Q1 2017.


Multi-Family: There were 16 multi-family land sales in the Lower Mainland in Q1 2018, which is down 44.8 per cent over the 29 sales in Q1 2017. The dollar value of multi-family sales was $0.081 billion in Q1 2018, an 81.5 per cent decrease from $0.441 billion in Q1 2017.


Click here for full Report.....


Provided By: REBGV

Read

No, Vancouver doesn't have an insanely low property tax


Boy, this new Vancouver property tax increase — the charmingly named "school tax" — sure is causing a lot of commotion. It can be as little as a few hundred if your home is worth just over $3 million, but if you are lucky enough to own a $6-million house, you better find another $10,000 on top of your usual property tax, every year. Of course, you can defer the whole tax at a low interest rate and pay it when you sell, which is a pretty good deal, but some just don't want more debt on their head after working hard to be mortgage free. Poor things.


People suffering under this housing crisis have about as much sympathy for these paper millionaires as they do "student" owners of Point Grey mansions.There seems to be a number of factors at play with this, some of it verging on class war in its intensity and vitriol.


How dare these "lottery winners" complain about a few thousand dollars tax increase? We all wish we had such problems, right? Paying some more property tax on a windfall does seem entirely reasonable, but how much and who should pay? Is this a wedge issue which widens the divide, or is it entirely reasonable that those who are sitting on a fortune, pay a little more?


Some homeowners affected by the increase feel that their homes ought to be considered a holding and taxed just like your pension, stock investment or Ferrari — that is to say "never" in Canada's case, where holdings aren't taxed simply because you own them. Instead, you pay when you purchase a holding or you realize the gain by selling.

Thus, the nature of this tax increase is somewhat historic — but so are Vancouver's house prices. Perhaps unique approaches are necessary.

Are Vancouver's property taxes really lower than in other Canadian cities?

UBC professor Tom Davidoff is a leading commentator on housing-related subjects and very charming guy to boot. He claims that "our property tax rates are incredibly low." He feels that increases are not only reasonable, but absolutely due. Policy on property tax rates is another discussion. In this blog, we are looking at Professor Davidoff's claim about the relative cost of Vancouver residential property tax which Davidoff equates with the rate used to calculate, rather than the dollar amount paid. He uses it to support the notion that we are due for considerable increases at least on that basis alone.


So, are Vancouver property tax rates really so much lower than in other cities in Canada?


To answer that, you have to understand how property tax works, and it seems many don't. Property tax is not calculated like income tax, which multiplies your income by a set of ratios to determine amount owing. Instead, property tax is based on a property's assessed value relative to other homes, which is then multiplied by the "mill rate" (the percentage of a home's assessed value that is taxed).


This ensures that cities facing hyperinflation, like Vancouver, won't see absurdly high property tax increases as assessed values skyrocket (as they have over the past decade) — and that taxes collected aren't suddenly reduced to a trickle in cities where assessed values may drop. This calculation is used because cities set taxes against a projected budget, and that money needs to be collected in a reasonably predictable manner from the pool of properties that can be taxed.


(Here's a more detailed article about all this in Torontoist.)


© Provided by AOL Inc. Homes in Forest Hill, a Toronto wealthy neighbourhood. 

Making a more accurate tax comparison

The confusion happens when tax rate is conflated with tax paid which, as I say, is Professor Davidoff's position. Sure, Vancouver's tax rate is low (the "mill rate") compared to other cities, but this rate alone will not give you a proper comparison between cities' property taxes. You'd have to look at similar dwellings in similar areas in different cities in order to find a true like-for-like comparison.


I know Toronto well, so it's easy for me to compare. In terms of dividing the pool of homes by a mill rate to achieve a taxable amount, identical houses in three different cities should pay about the same. The Forest Hill area of Toronto is a tony neighbourhood much like Point Grey or Dunbar in Vancouver. However, if you look at similar homes in those areas, the tax amount — the dollar figure — is, in most cases, higher in Vancouver.


A newer, high-end, four-bedroom and six-bathroom house for sale right now on a large lot in Forest Hill has a tax of $8,467. Other examples in Forest Hill are more like $10,000, or a bit more. Similar homes in Dunbar have a tax closer to $11,000 — higher in all cases I examined, and that is before adding the new school tax addition.


Let's look at a specific example which seems pretty typical. Vancouver's Kerrisdale neighbourhood could be considered similar to Midtown Toronto. This nearly new home on Vine in Kerrisdale was built to a very high standard and has a tax of $13,530.


Here's a home in midtown Toronto which I would consider roughly similar in finish and location and size. It's on Glengarry Avenue. The tax is $13,001. It's featured in The Globe, so you can see the level of finish and the fancy wine cellar. This is a nice home.


I don't know Calgary that well, but here is a lovely, central house of a very high standard, and easily compares in quality to the Vancouver examples. Taxes on this would be $11,453 based on the asking price. Assessed value might actually be a bit lower, as it usually is. That, again, is less than Vancouver property tax for a similar property.


a house that has a sign on the side of a building© Provided by AOL Inc.


Here we have very similar homes with either similar or higher taxes in Vancouver. I based this example on a number of examples I researched, so they are not unique. 

A lower tax rate in Vancouver 

So what about the rate being lower?

It is true that the rate on the dollar is lower. It's $12.68 per $1,000 in Saskatoon, but Vancouver's is a mere $3.68. Wow! That means investors will pay less tax per dollar in Vancouver than in other cities like Saskatoon — but we should not focus broad tax policy on investors and speculators. That's unfair on people who just want to live in their home. And, besides, there are other considerable factors when you look at investment cost, principally the far higher capital outlay required to buy the same house in Vancouver and the lower rent relative to capital cost compared to any other Canadian city. To the investor, that is a far greater financial consideration than the tax paid.


Provided By: David Fine with HuffPost Canada


Read

Just Sold: 601 9310 University Cr., Simon Fraser University

Spacious and Open Layout

2 bed & Den Concrete Home

Priced at $698,000


 Click here for more details....


Gorgeous Mountain & Water views! Welcome to this 2bed+den/2bath/1205sqft luxury concrete home, located in OneUniversity of UniverCity at SFU; Vancouver's premier lifestyle neighborhood. Features: East/West exposure from 2 large covered balconies, engineered floors, 9’ ceilings, open kitchen w/SS apps, quartz counters & breakfast bar. Enjoy a large master complete with his/her walk-through closet, 5pc ensuite w/soaker & separate shower. Benefit from the spacious 2nd w/plenty of closet space & an open den; perfect home office. Bonus: 1 parking, 1 locker & well-appointed complex amenities w/gym. Close to: transit, shopping, indoor/outdoor rec. & a host of perks available only to UniverCity residents. Act Now! 
Read

The British Columbia Real Estate Association (BCREA) reports that a total of 8,837 residential unit sales were recorded by the Multiple Listing Service® (MLS®) across the province in May, a 28.7 per cent decrease from the same month last year. The average MLS® residential price in BC was $739,783, down 1.7 per cent from May 2017. Total sales dollar volume was $6.54 billion, a 30 per cent decline from May 2017.


“BC home sales continued to slow in May because of more stringent qualifications for conventional
borrowers,” said Cameron Muir, BCREA Chief Economist. “The changes in mortgage policy are taking their toll on housing demand, not only in British Columbia, but across the country by reducing household purchasing power and housing affordability.”


While the decline in consumer demand has lifted the inventory of homes for sale, total active residential listings in the province are still relatively low by historical comparison.


Year-to-date, BC residential sales dollar volume was down 13.8 per cent to $26.4 billion, compared with the same period in 2017. Residential unit sales decreased 16.6 per cent to 35,976 units, while the average MLS® residential price was up 3.4 per cent to $733,616.


May 2018 Year-to-Date BC Residential Multiple Listing Service® Data by Board


Board

Dollar Volume (000s)

Unit Sales

Average Price


2018

($)

2017

($)

% change

2018

2017

%

change

2018

($)

2017

($)

% change

BC Northern

469,174

456,218

2.8

1,631

1,650

-1.2

287,660

276,496

4


Chilliwack


746,799


732,522


1.9


1,432


1,645


-12.9


521,507


445,302


17.1

Fraser Valley

5,534,251

6,179,206

-10.4

7,329

9,077

-19.3

755,117

680,754

10.9


Greater Vancouver


12,903,958


16,149,318


-20.1


12,159


15,688


-22.5


1,061,268


1,029,406


3.1

Kamloops

466,668

467,237

-0.1

1,224

1,300

-5.8

381,265

359,413

6.1


Kootenay


362,329


356,071


1.8


1,187


1,175


1


305,248


303,039


0.7


Okanagan Mainline


1,639,849


1,771,628


-7.4


3,143


3,652


-13.9


521,746


485,112


7.6

Powell River

50,271

43,438

15.7

137

146

-6.2

366,944

297,521

23.3

South Okanagan

372,698

379,846

-1.9

884

994

-11.1

421,604

382,139

10.3

Northern Lights

35,478

38,081

-6.8

139

157

-11.5

255,234

242,554

5.2

Vancouver Island

1,682,555

1,638,647

2.7

3,660

3,910

-6.4

459,714

419,091

9.7

Victoria

2,128,546

2,409,085

-11.6

3,051

3,760

-18.9

697,655

640,714

8.9

Provincial Totals*

26,392,574

30,621,295

-13.8

35,976

43,154

-16.6

733,616

709,582

3.4

* Numbers may not add due to rounding


Provided by: BCREA

Read
Reciprocity Logo The data relating to real estate on this website comes in part from the MLS® Reciprocity program of either the Greater Vancouver REALTORS® (GVR), the Fraser Valley Real Estate Board (FVREB) or the Chilliwack and District Real Estate Board (CADREB). Real estate listings held by participating real estate firms are marked with the MLS® logo and detailed information about the listing includes the name of the listing agent. This representation is based in whole or part on data generated by either the GVR, the FVREB or the CADREB which assumes no responsibility for its accuracy. The materials contained on this page may not be reproduced without the express written consent of either the GVR, the FVREB or the CADREB.