RSS

Federal budget includes first-time buyer incentives


On the eve of a federal election this fall, the Liberal government is looking to help more Canadians buy their first homes by picking up a portion of their mortgage costs and increasing the amount they can borrow from their retirement savings for a down payment.


Helping people enter the housing market has been a growing preoccupation for the Liberals ever since they were elected in 2015, with soaring real-estate prices in some of Canada's largest cities putting home ownership beyond the reach of many.


An estimated 1.6 million Canadian households are considered in ``core housing need,'' meaning people who are living in places that are either too expensive or don't suit their needs.


The means-tested incentive the Liberals unveiled Tuesday would only be available to households with incomes under $120,000 _ roughly $50,000 more than the median household income as calculated by Statistics Canada _ and on mortgages no more than four times the household's total income.


Eligible buyers would see the government pick up part of the costs of their mortgages to lower their monthly payments, with the amount of help determined by their incomes and whether they're buying an existing or newly built home.


The government also plans to raise the maximum amount a first-time buyer can withdraw from an RRSP: $35,000, up from $25,000. And while the program has long been restricted to new would-be homeowners, those who are recovering from the breakup of a marriage or common-law relationship would also be allowed to take part.


The measure, expected to cost $1.25 billion over three years beginning this fiscal year, would target Canadians ``that face legitimate challenges entering housing markets'' after qualifying for a mortgage, the budget document says. An additional $100 million would flow to the Canada Mortgage and Housing Corporation to help organizations that already provide the so-called ``shared equity mortgages.''


The government would recoup its costs when the house is sold, although the budget document isn't clear what would happen if the home is sold for a loss.


The program, some details of which are yet to be finalized, is part of a tranche of spending that includes establishing a national expert panel on housing supply and affordability, better data collection, and $300 million for a contest to encourage cities to come up with new ways of expanding housing stock.


The new measures could increase the annual number of new homebuyers nationally to 140,000 from 100,000 by lowering monthly payments without creating higher household debt loads, said Finance Minister Bill Morneau, who was confident the measures won't cause a spike in housing prices.


``We're recognizing that it is challenging for people in the housing market; it's a real issue, but what we've done is we've carefully looked at what's the best way to deal with that issue,'' Morneau told a news conference.


``It's not going to make an impact on the overall market from a pricing standpoint, meaning people are actually going to be better off, more optimism in terms of housing, and it's the reason we're very excited about this measure.''


Economists and experts had been concerned that Morneau's focus on helping millennials, in particular, get footholds in the market could juice home prices after years of trying to cool demand in places like Toronto and Vancouver. Federal efforts, such as a new financial ``stress test'' to make sure a buyer can afford a mortgage, have slowed prices from where they might have been.


Scotiabank economist Marc Desormeaux said the Liberals opted for a relatively modest measure, considering the options they have.


``This is providing additional support for individuals who have already qualified for homes, helps them relieve some of their monthly payments once they've qualified for a mortgage and entered into the contract,'' Desormeaux said.

``The concerns about stoking demand from some of these measures aren't concerns that we would raise at this time.''


What the measures should do is increase supply _ one of the measure's stated goals. The government plans to cover five per cent of the cost of the purchase of an existing home and 10 per cent of a new build, hoping to ``encourage the home construction needed to address some of the housing supply shortages'' across the country, the budget document says.


Mathieu Laberge, an expert with Deloitte, said the measures appear to target people who would be willing to rent or buy smaller condominium units, for example, outside a major urban centre.


``It may shift the decision-making of some buyers in larger cities,'' said Laberge, a former policy adviser to Social Development Minister Jean-Yves Duclos. ``You're changing the relevant price between rental and home ownership in those areas, like the immediate suburbs of, for example, Vancouver and Toronto, which is a way to provide more options to households that would otherwise be priced out of the market.''


Tuesday's budget also includes $10 billion more for a program to fund the construction of new rental units _ the third time the Liberals have expanded the program, which aims to create 14,000 units over 10 years and now carries a $50-billion price tag.


Provided by: The Canadian Press

Read

Canadian home sales drop sharply in February 2019


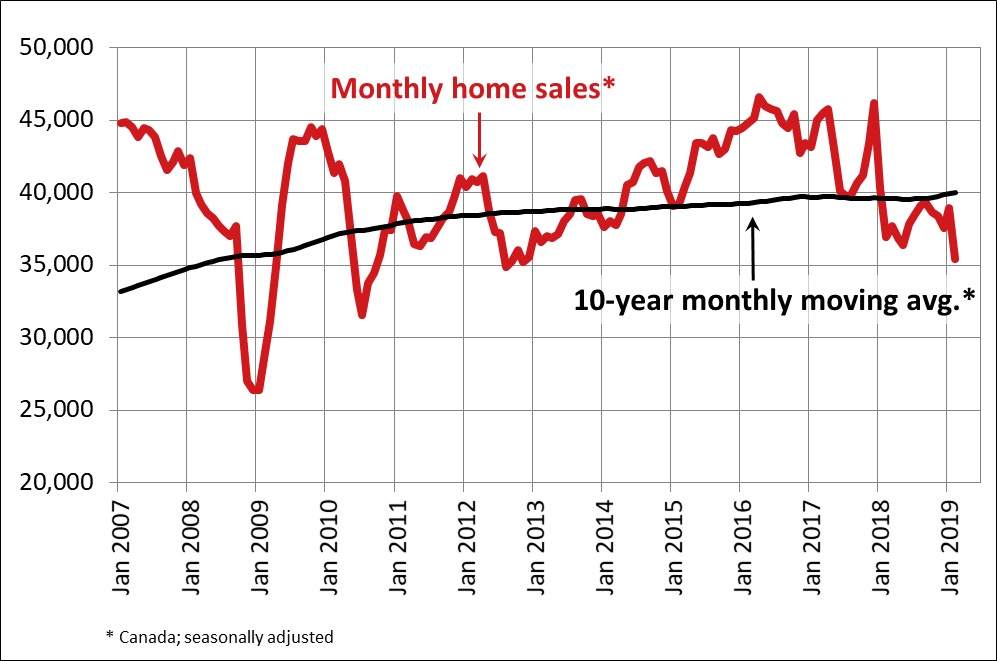
Statistics released today by the Canadian Real Estate Association (CREA) show national home sales dropped sharply from January to February 2019.

Highlights:

  • National home sales plummeted 9.1% month-over-month (m-o-m) in February.
  • Actual (not seasonally adjusted) activity was down 4.4% year-over-year (y-o-y).
  • The number of newly listed homes fell 3.2% m-o-m.
  • The MLS® Home Price Index (HPI) was virtually unchanged (-0.1% y-o-y).
  • The national average sale price fell by 5.2% y-o-y.

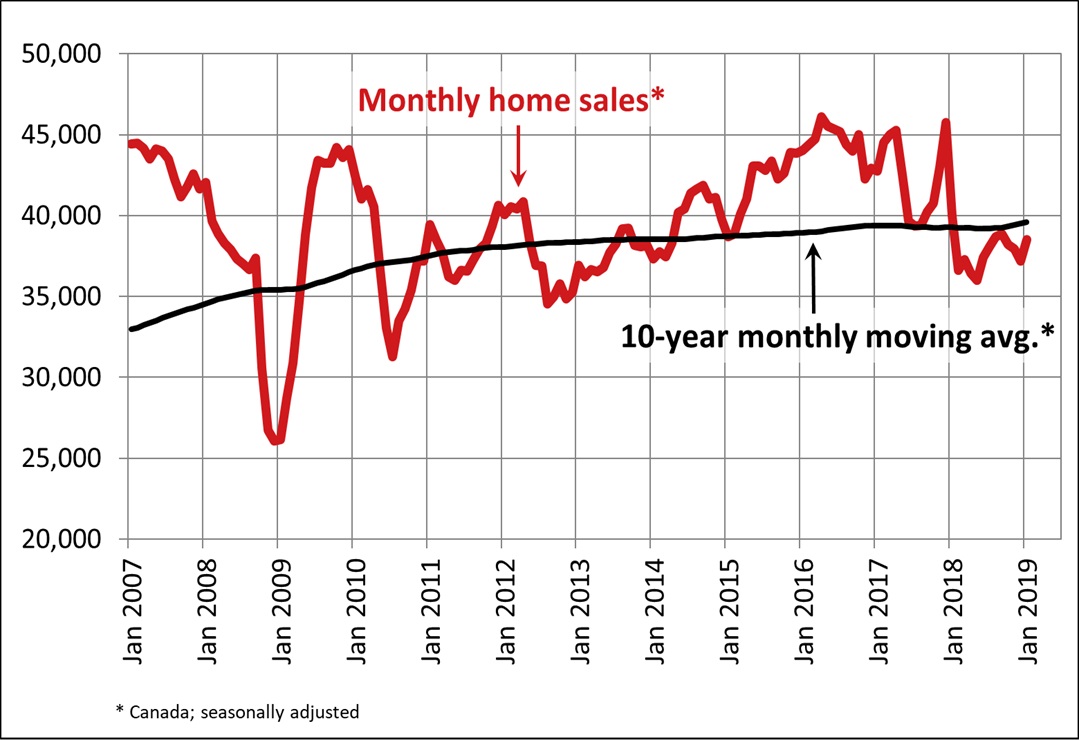
Home sales via Canadian MLS® Systems plunged 9.1% m-o-m in February 2019 to the lowest level since November 2012. The month-over-month decline was the largest recorded since the B-20 stress test came into effect in January of last year. (Chart A)


The number of homes trading hands was down from the previous month in three-quarters of all local markets, including all major cities.


Actual (not seasonally adjusted) sales activity was down 4.4% to reach the lowest level for month of February since 2009. It was also almost 12% below the 10-year February average. In British Columbia, Alberta as well as Newfoundland and Labrador, sales were more than 20% below their 10-year average for the month.


“For aspiring homebuyers being kept on the sidelines by the mortgage stress-test, it’s a bitter pill to swallow when policy makers say the policy is working as intended,” said Barb Sukkau. “Fewer qualified buyers means sellers are affected too. The impact of tighter mortgage regulations differs by local housing market and a professional REALTOR® remains your best source for information and guidance in negotiating the purchase or sale of a home during these changing times,” added Sukkau.


“February home sales declined across a broad swath of large and smaller Canadian cities,” said Gregory Klump, CREA’s Chief Economist. “The housing sector is on track to further reduce waning Canadian economic growth. Only time will tell whether successive changes to mortgage regulations went too far, since the impact of policy decisions becomes apparent only well after the fact. Hopefully policy makers are thinking about how to fine tune regulations to better keep housing affordability within reach while keeping lending risks in check.”


The number of newly listed homes declined by 3.2% in February, led by GTA regional municipalities that surround the City of Toronto, in addition to Hamilton-Burlington, Calgary, Edmonton and Winnipeg.


With sales down by more than new listings in February, the national sales-to-new listings ratio eased to 54.1% compared to 57.6% in January. Looking beyond its monthly volatility, this measure of market balance has remained close to the long-term average of 53.5% since early 2018.


Considering the degree and duration to which market balance readings are above or below their long-term averages is the best way of gauging whether local housing market conditions favour buyers or sellers. Market balance measures that are within one standard deviation of their long-term average are generally consistent with balanced market conditions.


Based on a comparison of the sales-to-new listings ratio with the long-term average, about 70% of all local markets were in balanced market territory in February 2019.


The number of months of inventory is another important measure of the balance between sales and the supply of listings. It represents how long it would take to liquidate current inventories at the current rate of sales activity.


There were 5.7 months of inventory on a national basis at the end of February 2019, a three-and-a-half-year high and a little above its long-term average of 5.3 months. That said, there are significant regional differences. The number of months of inventory has swollen far above its long-term average in Prairie provinces and Newfoundland & Labrador; as a result, homebuyers there have an ample choice of listings available for purchase. By contrast, the measure remains well below its long-term average in Ontario and the Maritimes.

The Aggregate Composite MLS® Home Price Index (MLS® HPI) was little changed (-0.1%) y-o-y in February 2019. That said, it still marked the first decline in almost a decade (Chart B).


Apartment units recorded a y-o-y price increase of 2.4% in February, while townhouse/row unit prices were up 1%. By comparison, one and two-storey single-family home prices were down 1.7% and 1% y-o-y in February.


Trends continue to vary widely among the 17 housing markets tracked by the MLS® HPI. Results remain mixed in British Columbia, with prices down on a y-o-y basis in Greater Vancouver (-6.1%) and the Fraser Valley (-2.8%). By contrast, prices posted a y-o-y increase of 3% in Victoria and were up 7.7% elsewhere on Vancouver Island.


Among Greater Golden Horseshoe housing markets tracked by the index, MLS® HPI benchmark home prices were up from year-ago levels in Guelph (+6.8%), the Niagara Region (+6.5%), Hamilton-Burlington (+5%) and the GTA (+2.3%). By contrast, home prices were little changed (+0.2%) on a y-o-y basis in Oakville-Milton, while in Barrie and District prices remain below year-ago levels (-4.3%).


Across the Prairies, supply is historically elevated relative to sales and home prices are down from year-ago levels. Benchmark prices were down by 4.4% in Calgary, 4.5% in Edmonton, 5.1% in Regina and 3% in Saskatoon. The home pricing environment will likely remain weak in these cities until demand and supply come back into better balance.


Home prices rose 7.4% y-o-y in Ottawa (led by a 10.8% increase in townhouse/row unit prices), 6.2% in Greater Montreal (led by a 7.8% increase in apartment unit prices) and 1.6% in Greater Moncton (led by a 7.9% increase in townhouse/row unit prices). (Table 1)


The MLS® HPI provides the best way to gauge price trends, as averages are strongly distorted by changes in the mix of sales activity from one month to the next.


The actual (not seasonally adjusted) national average price for homes sold in February 2019 was $468,350, down 5.2% from the same month in 2018.


The national average price is heavily skewed by sales in Greater Vancouver and the GTA, two of Canada’s most active and expensive markets. Excluding these two markets from calculations cuts close to $100,000 from the national average price, trimming it to just under $371,000.


Provided by: CREA

Read

Mortgage Stress Test Continues to Dampen Home Sales in February

The British Columbia Real Estate Association (BCREA) reports that a total of 4,533 residential unit sales were recorded by the Multiple Listing Service® (MLS®) in February, a decline of 27 per cent from the same month last year. The average
MLS® residential price in the province was $678,625, a decline of 9.3 per cent from February 2018. Total sales dollar volume was $3.08 billion, a 33.8 per cent decline from the same month last year.


“Prospective homebuyers continue to be sidelined by the mortgage stress test,” said Brendon Ogmundson, BCREA
Deputy Chief Economist. “As a consequence, and despite a strong BC labour market, sales remained slow in February.”


Total MLS® residential active listings increased 36.5 per cent to 30,891 units compared to the same month last year. The ratio of sales to active residential listings declined from 27.4 per cent to 14.7 per cent over the same period.


“Falling mortgage rates should provide some relief for homebuyers, providing a small boost to affordability heading into the spring,” added Ogmundson.


Click here for more information


Provided by: BCREA

Read


The Bank of Canada today maintained its target for the overnight rate at 1 ¾ per cent. The Bank Rate is correspondingly 2 per cent and the deposit rate is 1 ½ per cent. 


Recent data suggest that the slowdown in the global economy has been more pronounced and widespread than the Bank had forecast in its January Monetary Policy Report (MPR). While the sources of moderation appear to be multiple, trade tensions and uncertainty are weighing heavily on confidence and economic activity. It is difficult to disentangle these confidence effects from other adverse factors, but it is clear that global economic prospects would be buoyed by the resolution of trade conflicts. 


 Many central banks have acknowledged the building headwinds to growth, and financial conditions have eased as a result. Meanwhile, progress in US-China trade talks and policy stimulus in China have improved market sentiment and contributed to firmer commodity prices. 


For Canada, the Bank was projecting a temporary slowdown in late 2018 and early 2019, mainly because of last year’s drop in oil prices. The Bank had forecast weak exports and investment in the energy sector and a decline in household spending in oil-producing provinces. However, the slowdown in the fourth quarter was sharper and more broadly based. Consumer spending and the housing market were soft, despite strong growth in employment and labour income. Both exports and business investment also fell short of expectations. After growing at a pace of 1.8 per cent in 2018, it now appears that the economy will be weaker in the first half of 2019 than the Bank projected in January. 


Core inflation measures remain close to 2 per cent. CPI inflation eased to 1.4 per cent in January, largely because of lower gasoline prices. The Bank expects CPI inflation to be slightly below the 2 per cent target through most of 2019, reflecting the impact of temporary factors, including the drag from lower energy prices and a wider output gap. 


Governing Council judges that the outlook continues to warrant a policy interest rate that is below its neutral range. Given the mixed picture that the data present, it will take time to gauge the persistence of below-potential growth and the implications for the inflation outlook. With increased uncertainty about the timing of future rate increases, Governing Council will be watching closely developments in household spending, oil markets, and global trade policy. 


Provided by: Bank of Canada

Read

Housing market conditions continue to favour home buyers


The Metro Vancouver* housing market saw increased supply from home sellers and below average demand from home buyers in February.


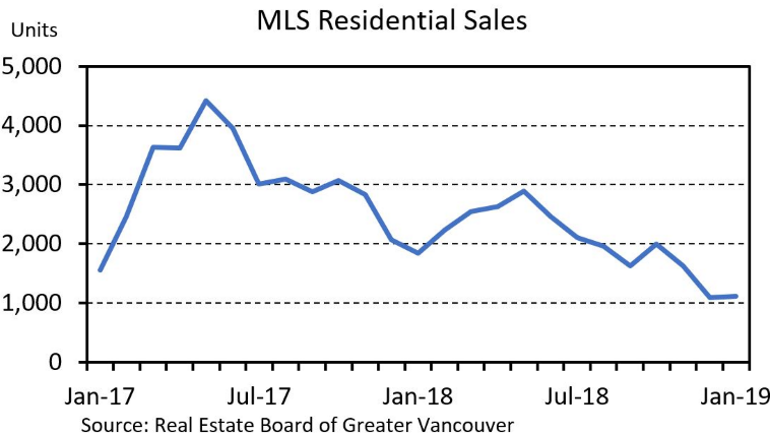
The Real Estate Board of Greater Vancouver (REBGV) reports that residential home sales in the region totalled 1,484 in February 2019, a 32.8 per cent decrease from the 2,207 sales recorded in February 2018, and a 34.5 per cent increase from the 1,103 homes sold in January 2019.


Last month’s sales were 42.5 per cent below the 10-year February sales average.


“For much of the past four years, we’ve been in a sellers’ market. Conditions have shifted over the last 12 months to favour buyers, particularly in the detached home market,” Phil Moore, REBGV president said. “This means that home buyers face less competition today, have more selection to choose from and more time to make their decisions.”


There were 3,892 detached, attached and apartment properties newly listed for sale on the Multiple Listing Service® (MLS®) in Metro Vancouver in February 2019. This represents a 7.8 per cent decrease compared to the 4,223 homes listed in February 2018 and a 19.7 per cent decrease compared to the 4,848 homes listed in January 2019.


The total number of homes currently listed for sale on the MLS® system in Metro Vancouver is 11,590, a 48.2 per cent increase compared to February 2018 (7,822) and a 7.2 per cent increase compared to January 2019 (10,808).


For all property types, the sales-to-active listings ratio for February 2019 is 12.8 per cent.


Generally, analysts say that downward pressure on home prices occurs when the ratio dips below the 12 per cent mark for a sustained period, while home prices often experience upward pressure when it surpasses 20 per cent over several months.


“Homes priced well for today’s market are attracting interest, however, buyers are choosing to take a wait-and-see approach for the time being,” Moore said. “REALTORS® continue to experience more traffic at open houses. We’ll see if this trend leads to increased sales activityduring the spring market.”


The MLS® Home Price Index composite benchmark price for all residential properties in Metro Vancouver is currently $1,016,600. This represents a 6.1 per cent decrease over February 2018, a 6.2 per cent decrease over the past six months, and a 0.3 per cent decrease compared to January 2019.


Sales of detached homes in February 2019 reached 448, a 27.9 per decrease cent from the 621 detached sales recorded in February 2018. The benchmark price for detached properties is $1,443,100. This represents a 9.7 per cent decrease from February 2018, a 7.6 per cent decrease over the past six months, and a 0.7 per cent decrease compared to January 2019.


Sales of apartment homes reached 759 in February 2019, a 35.9 per cent decrease compared to the 1,185 sales in February 2018. The benchmark price of an apartment property is $660,300. This represents a four per cent decrease from February 2018, a 5.1 per cent decrease over the past six months, and a 0.3 per cent increase compared to January 2019.


Attached home sales in February 2019 totalled 277, a 30.9 per cent decrease compared to the 401 sales in February 2018. The benchmark price of an attached unit is $789,300. This represents a 3.3 per cent decrease from February 2018, a 6.7 per cent decrease over the past six months, and a 1.4 per cent decrease compared to January 2019.


Click here for more...


Provided by: REBGV

Read

CLI Points to Flattening Commercial Activity in 2019

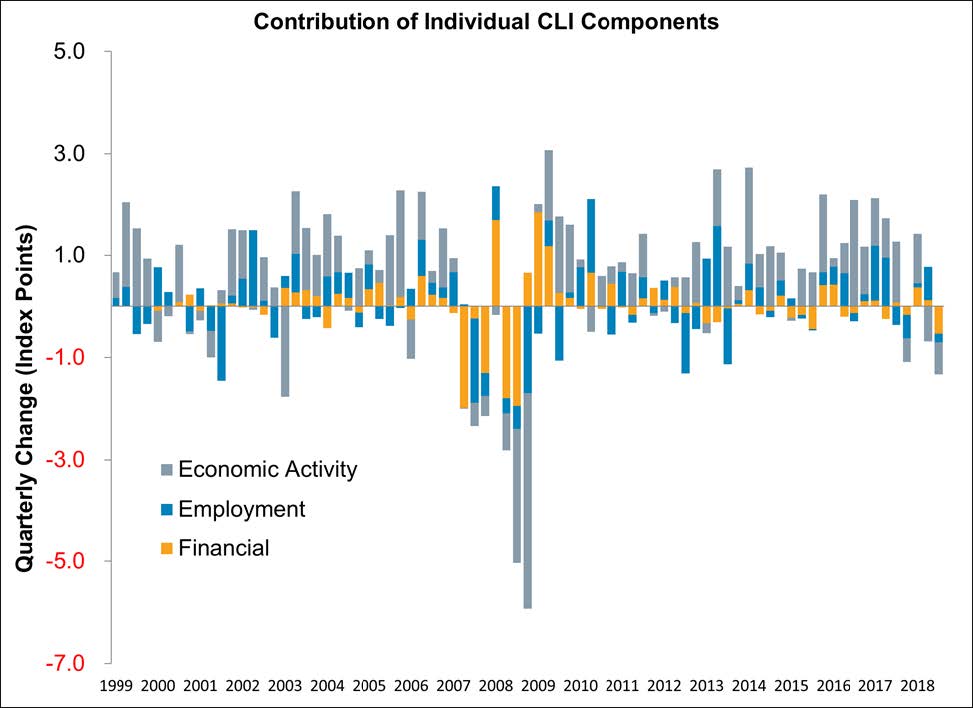
The BCREA Commercial Leading Indicator (CLI) declined by 1.8 points to 134.5 from the third to the fourth quarter of 2018. Compared to this time one year ago, the index is about 1 per cent lower.


“Following several years of robust growth, the BC economy slowed in 2018 and the CLI is reflecting that slowdown,” says BCREA Deputy Chief Economist Brendon Ogmundson. “That means the economic environment for commercial real estate activity will be less favourable in 2019.”


Slowing provincial economic activity continued in the fourth quarter, led by weak retail sales and a fourth quarter drop in manufacturing shipments in the forestry sector. Adding to those declines were falling manufacturing employment and a jump in short-term credit risk spreads. As a result, each component of the CLI posted a decline in the fourth quarter. Recent volatility in the CLI has left the underlying trend in the CLI flat over the past two quarters, signaling a slower growth environment for commercial real estate activity. 


Click here for more...


Provided by: BCREA

“Copyright British Columbia Real Estate Association. Reprinted with permission.” 

Read

BCREA 2019 First Quarter Housing Forecast Update 


The British Columbia Real Estate Association (BCREA) released its 2019 First Quarter Housing Forecast Update today.
Multiple Listing Service® (MLS®) residential sales in the province are forecast to increase 2 per cent to 80,000 units this year, after recording 78,345 residential sales in 2018. MLS® residential sales are forecast to increase a further 6.9 per cent to 85,500 units in 2020. The 10-year average for MLS® residential sales in the province is 85,800 units.


“The negative shock to affordability and purchasing power created by the B20 stress test on mortgage borrowers is expected to continue constraining housing demand in the province this year,” said Cameron Muir, BCREA Chief Economist. “Favourable demographics along with continuing strong performance of the BC economy is expected to underpin housing demand over the next two years.”


The policy-induced demand shock has contributed to an increase of the inventory of homes for sale in most regions of the province. As a result, market conditions are expected to provide little upward pressure on home prices this year, with the average annual residential price forecast to remain essentially unchanged, albeit up 0.5 per cent to $716,100.


Modest improvement in consumer demand is expected to unfold over the next two years as households further adjust to the mortgage stress test.


click here for more...


Provided by: BCREA

“Copyright British Columbia Real Estate Association. Reprinted with permission.” 

Read

Nothing for home buyers in Budget 2019


BC Budget 2019, tabled on February 19, 2019 by Finance Minister Carole James, offers nothing to help home buyers – whether they’re first-timers or trading up.


The government is forecasting Property Transfer Tax (PTT) revenue to remain at $1.910 billion, despite a significant slowdown in home sales and housing starts.

Housing starts

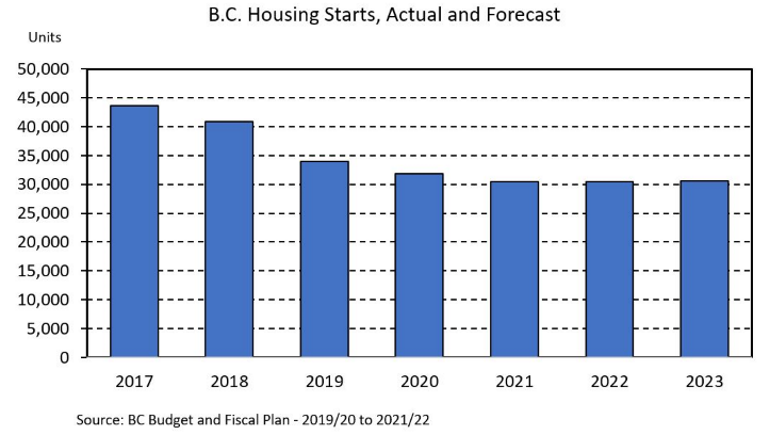
Housing starts fell 6.4 per cent in 2018 and are forecast to drop 16.7 per cent to 34,000 units in 2019 from 40,857 units in 2018 and 43,664 in 2017. Starts are forecast to decline even further to 30,517 units in 2021.

The Speculation and Vacancy Tax

  • Forecast to bring in $87 million in 2018/2019 and $185 million in each of the three fiscal years following.

The Real Estate Board of Greater Vancouver recommendations

  • increase the First-Time Home Buyers’ Program PTT exemption threshold to $750,000 from $500,000.
  • increase the 1% PTT threshold to $525,000 from $200,000 for all home buyers.
  • index PTT thresholds using the consumer price index, and make adjustments annually for the:expand the exemption for the additional 20% foreign buyers’ PTT to include everyone with a work permit in BC, and don’t increase this tax or expand it beyond its current geographical scope.
    • 2% and 3% thresholds;
    • First-Time Home Buyers’ Program exemption threshold; and
    • Newly Built Home Exemption threshold.
    • expand the exemption for the additional 20% foreign buyers’ PTT to include everyone with a work permit in BC, and don’t increase this tax or expand it beyond its current geographical scope.

The government did not implement any of these recommendations.

Other Budget highlights

Anti-money laundering
  • $6 million for Anti-money laundering, cannabis legislation and gun and gang violence.
Speculation and Vacancy Tax – retroactive to November 27, 2018:
  • There’s an exemption for property that's uninhabitable due to a natural disaster or a hazardous condition for at least 60 days.
Renters
  • Funding to community organizations to operate rent banks to help tenants in danger of losing their homes.
  • Funding for short-term loans with low/no interest to low-income tenants in financial crisis who can’t pay rent.

Although the government promised to introduce a $400 annual renters’ rebate, this is missing from this budget.

CleanBC
  • Additional funding of $679 million for the CleanBC plan includes $58 million to make homes/ buildings more energy efficient. This covers rebates up to $14,000 for energy efficiency home improvements and $700 for high-efficiency natural gas furnaces. Rebates up to $6,000 apply to new zero-emission vehicles.
Provided by: REBGV
Read

Canadian home sales improve in January 2019


Statistics released today by the Canadian Real Estate Association (CREA) show national home sales in January 2019 were up from the previous month but remained below levels recorded one year ago.

Highlights:

  • National home sales rose 3.6% between December 2018 and January 2019.
  • Actual (not seasonally adjusted) activity was down by 4% from one year ago.
  • The number of newly listed homes edged up 1% month-over-month in January.
  • The MLS® Home Price Index (HPI) rose 0.8% year-over-year (y-o-y) in January.
  • The national average sale price fell by 5.5% y-o-y in January.

Home sales via Canadian MLS® Systems climbed 3.6% in January 2019 compared to December 2018 (Chart A). The number of homes trading handswas up from the previous month in half of all local markets, led by Montreal, Ottawa and Winnipeg.


Actual (not seasonally adjusted) were down 4% from year-ago levels and turned in the weakest January since 2015. They also came in below the 10-year average for the month on a national basis and in Canada’s three westernmost provinces, Ontario and Newfoundland & Labrador.


“Homebuyers are still adapting to tightened mortgage regulations brought in last year, “said CREA President Barb Sukkau. “However, their impact on homebuyers varies by location, housing type and price segment. All real estate is local. A professional REALTOR®remains your best source for information and guidance in negotiating the purchase or sale of a home during these changing times,” added Sukkau.


“Sales, market balance and home price trends are out of synch among major Canadian cities that have the greatest impact on national results,” said Gregory Klump, CREA’s Chief Economist. “It’s clear that housing market conditions remain weaker in the Prairie region and the Lower Mainland of British Columbia. Notwithstanding the intended consequences, tighter mortgage regulations that took effect in 2018 combined with previous tightening will weigh on economic growth this year.”


The number of newly listed homes edged up 1% in January, led by a jump in new supply in Greater Vancouver and Hamilton-Burlington.


With sales up by more than new listings, the national sales-to-new listings ratio tightened to 56.7% compared to 55.3% posted in December. This measure of market balance has remained close to its long-term average of 53.5% for the last year.


Considering the degree and duration to which market balance readings are above or below their long-term averages is the best way of gauging whether local housing market conditions favour buyers or sellers. Market balance measures that are within one standard deviation of their long-term average are generally consistent with balanced market conditions.


Based on a comparison of the sales-to-new listings ratio with the long-term average, more than half of all local markets were in balanced market territory in January 2019.


The number of months of inventory is another important measure for the balance between sales and the supply of listings. It represents how long it would take to liquidate current inventories at the current rate of sales activity.


There were 5.3 months of inventory on a national basis at the end of January 2019, in line with its long-term average. That said, the well-balanced national reading masks significant regional differences. The number of months of inventory has swollen far above its long-term average in Prairie provinces and Newfoundland & Labrador; as a result, homebuyers there have an ample choice of listings available for purchase. By contrast, the measure remains well below its long-term average in Ontario and Prince Edward Island, consistent with seller’s market conditions. In other provinces, sales and inventory are more balanced.


The Aggregate Composite MLS® Home Price Index (MLS® HPI) was up 0.8% y-o-y in January 2019 – the smallest increase since June 2018 (Chart B).


Apartment units recorded the largest y-o-y price increase in January (+3.3%), followed by townhouse/row units (+1.5%). By comparison, two-storey single-family home prices were little changed (+0.1%) while one-storey single-family home prices edged down (-1.1%).


Trends continue to vary widely among the 17 housing markets tracked by the MLS® HPI. Results were mixed in British Columbia. Prices were down on a y-o-y basis in Greater Vancouver (-4.5%) and the Fraser Valley (-0.8%). By contrast, prices posted a y-o-y increase of 4.2% in Victoria and were up 9.3% elsewhere on Vancouver Island.


Among Greater Golden Horseshoe housing markets tracked by the index, MLS® HPI benchmark home prices were up from year-ago levels in Guelph (+7.2%), the Niagara Region (+7%), Hamilton-Burlington (+5%), Oakville-Milton (+3.9%) and the GTA (+2.7%). By contrast, home prices in Barrie and District remain below year-ago levels (-2.7%).


Across the Prairies, supply is historically elevated relative to sales, causing benchmark home prices to remain down from year-ago levels in Calgary (-3.9%), Edmonton (-2.9%), Regina (-3.8%) and Saskatoon (-2%). The home pricing environment will likely remain weak in these cities until elevated supply is reduced.


Home prices rose 7.1% y-o-y in Ottawa (led by a 9.5% increase in townhouse/row unit prices), 6.3% in Greater Montreal (led by a 9.2% increase in townhouse/row unit prices) and 1% in Greater Moncton (led by a 15.1% increase in townhouse/row unit prices). (Table 1)


The MLS® HPI provides the best way to gauge price trends, as averages are strongly distorted by changes in the mix of sales activity from one month to the next.


The actual (not seasonally adjusted) national average price for homes sold in January 2019 was

just under $455,000, down 5.5% from the same month in 2018 and marking the biggest year-over-year decline since May 2018.


The national average price is heavily skewed by sales in Greater Vancouver and the GTA, two of Canada’s most active and expensive markets. Excluding these two markets from calculations cuts almost $95,000 from the national average price, trimming it to just over $360,000.


Provided by: CREA

Read

The British Columbia Real Estate Association (BCREA) reports that a total of 3,546 residential unit sales were recorded by the Multiple Listing Service® (MLS®) in January, a decline of 33.2 per cent from the same month last year. The average MLS® residential price in the province was $665,590, a decline of 7.7 per cent from January 2018. Total sales dollar volume was $2.36 billion, a 38.4 per cent decline from the same month last year. “BC households continue to grapple with the policyinduced affordability shock created last year by the federal government,” said Cameron Muir, BCREA Chief Economist. “The resulting pullback in consumer demand is largely responsible for January’s lacklustre performance.”

Total MLS® residential active listings increased 41.2 per cent to 29,522 units compared to the same month last year. The ratio of sales to active residential listings declined from 25.4 per cent to 12 per cent over the same period.

“Many BC regions are now exhibiting buyer’s market conditions,” added Muir. “However, BC Northern, the Kootenay, Okanagan Mainline and the Vancouver Island markets continue to reflect balance between supply and demand.”


click here for more...


Provied by: BCREA

Read

THANK YOU to all my Clients


Thank you to all my clients in 2018 that made this possible. #2 agent in the Royal LePage West Real Estate Services office consisting of 200+ realtors. Honoured to have been presented this award by Phil Soper President and CEO of Brookfield Real Estate Services owners of Royal LePage Canada.

Read

Just Sold: 212 22277 122 Ave., Maple Ridge, West Central

Fully Renovated

Huge 2nd Story Deck

Price at $374,800


click here for more...


Completely renovated. From the floors to the light fixtures; from the paint to the blinds; nothing to do but move right in! Shows well, you will not be disappointed. Located in The Gardens complex with a walk-score of 81. Close to: shopping, rec., transit, schools, parks & all types of amenities. This bright 2 bed, 2 bath, 1051sqft home features a spacious layout, laminate floors throughout, remodeled kitchen w/newer appliances, soft close cabinets, tons of cupboard/counter space, cozy gas F/P, newer W/D & a massive deck overlooking garden space; perfect for entertaining. The large master has 4pc ensuite & walk-in closet while the 2nd bed has a cheater ensuite. Bonus: 2 parking & locker. Act Now!

Read
Reciprocity Logo The data relating to real estate on this website comes in part from the MLS® Reciprocity program of either the Greater Vancouver REALTORS® (GVR), the Fraser Valley Real Estate Board (FVREB) or the Chilliwack and District Real Estate Board (CADREB). Real estate listings held by participating real estate firms are marked with the MLS® logo and detailed information about the listing includes the name of the listing agent. This representation is based in whole or part on data generated by either the GVR, the FVREB or the CADREB which assumes no responsibility for its accuracy. The materials contained on this page may not be reproduced without the express written consent of either the GVR, the FVREB or the CADREB.