RSS

Canadian House Prices To Drop As 'Huge' Wave Of New Homes Arrives: Report


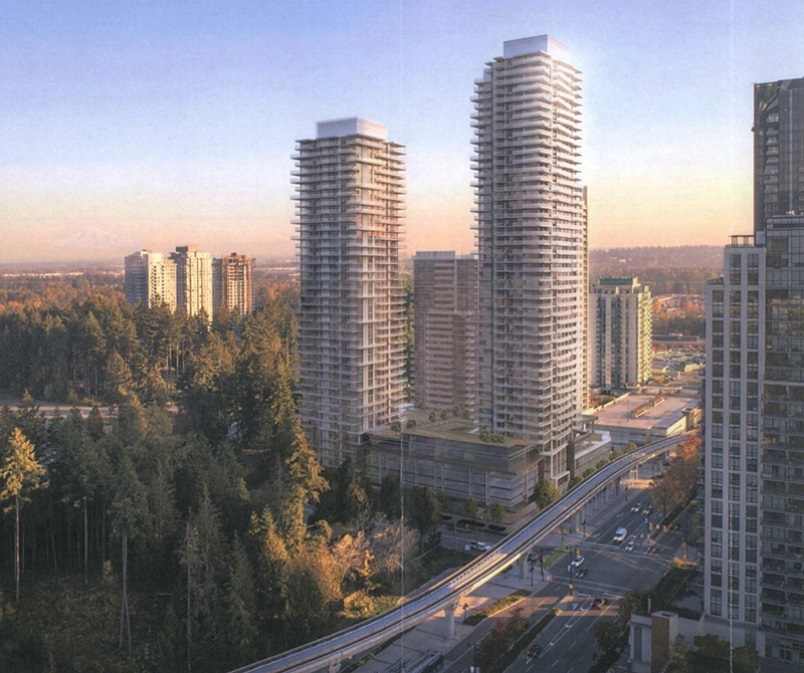
The slowdown in Canada's housing market will get worse before it gets any better, a new analysis predicts, because the country is about to be flooded with a "huge amount" of new homes.


"Canada has been undergoing a construction boom," Capital Economics senior economist Stephen Brown wrote in the report issued last week. "As has been typical of historic real estate cycles around the world, new supply will reach the market just as demand is falling."


Indeed, home sales in Toronto in 2018 were 15 per cent below their historical norm in 2018, while in Vancouver they ran 40 per cent below the long-run average.


If the percentage of unsold new homes in Vancouver remains what it is, the number of unsold houses on the market will double in the metro area over the next two years as 40,000 new homes come on the market, Brown predicted.


a screenshot of a cell phone: Unsold units in Vancouver will pile up over the next two years, even if developers cut new construction to zero.© Provided by Oath Inc. Unsold units in Vancouver will pile up over the next two years, even if developers cut new construction to zero. 


The situation isn't quite so dire in Toronto — yet. Just one per cent of new homes in the area sits unsold, compared to 7 per cent in Vancouver. But Brown expects Toronto to follow in Vancouver's footsteps this year.


Developers will react by cutting back on new housing starts. But the lag between start and completion means the problem will happen regardless of what developers do now, Brown suggested. Even if Vancouver stopped building new homes entirely, the oversupply in the next two years would be nearly as large as if construction continued.


All of which could have a negative effect on the economy, starting with falling house prices.


"That, in turn, is likely to feed through to weaker consumer spending. Even more significantly, an end of the construction boom will weigh heavily on investment," Brown wrote.


But not everyone is convinced that the elevated levels of home construction mean there is an oversupply.


In a report last year, Bank of Montreal noted that Canada's population growth has accelerated in the past few years, thanks to higher immigration levels, and is now growing at the fastest pace in decades. That means we may be underestimating just what the "right" amount of new housing in Canada is, the bank's economists suggested.

"As has been typical of historic real estate cycles around the world, new supply will reach the market just as demand is falling."Stephen Brown, Capital Economics

That's also the view of many in the industry, who see a higher chance of housing shortages than oversupply in the coming years.


"With an increasing number of gainfully employed people looking to put a roof over their heads, and the scarce availability of rental accommodation, policy makers in our major markets will once again be struggling with housing shortages," said Phil Soper, president of realtor Royal LePage, in a market forecast in December.


"More than an affordable housing problem, we will once again be facing an overall housing supply crisis," Soper said.

"The future for Canadian housing remains bright, perhaps too bright."


Provided by:  HuffPost Canada on MSN Money


Read

Canadian Housing Starts Trend Decreases in December

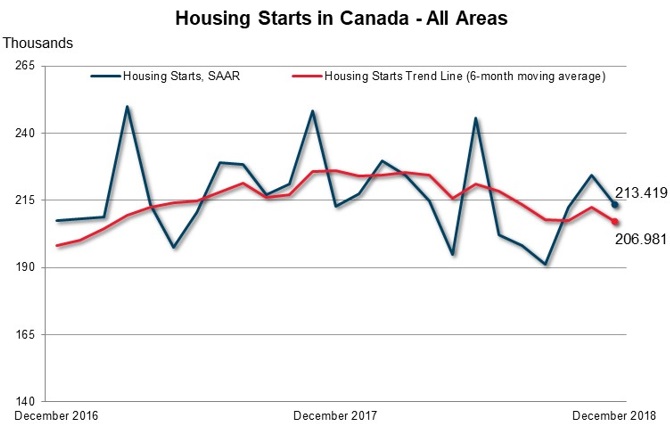
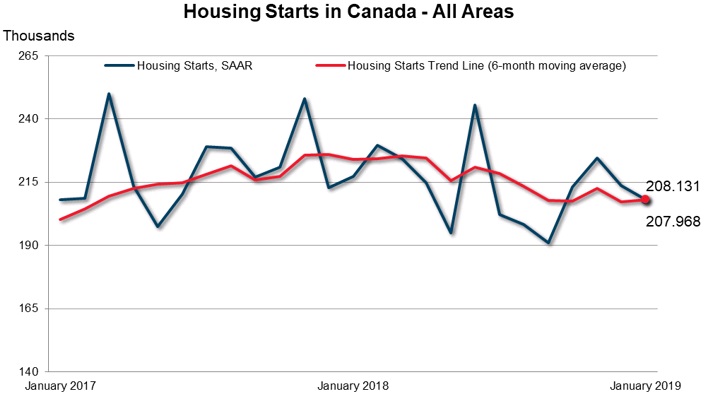
The trend in housing starts was 206,981 units in December 2018, compared to 212,338 units in November 2018, according to Canada Mortgage and Housing Corporation (CMHC). This trend measure is a six-month moving average of the monthly seasonally adjusted annual rates (SAAR) of housing starts.


"The national trend in housing starts decreased in December, the fifth decline in the last six months," said Bob Dugan, CMHC's chief economist. "Reflecting these recent declines, total annual housing starts in 2018 were lower than in 2017, as lower single-detached starts more than offset a slight increase in multi-family starts this year.


Nonetheless, total housing starts remain elevated when compared to historical averages."

Monthly Highlights

Vancouver

Housing starts in the Vancouver Census Metropolitan Area (CMA) continued trending lower in December 2018, ending the year with an 11% decrease compared to 2017 despite that rental units rose by 40% in response to a tight rental market. City of Vancouver’s rental and condo sectors are the top two drivers to the annual housing starts. Surrey led the overall decline with housing starts down by 27% in 2018.

Victoria

Total year-to-date housing starts initiated in Metro Victoria reached a level not seen since 1976 in December. Rental units were half of all housing starts in 2018 in response to heightened rental demand and low vacancy rates.

Edmonton

Edmonton housing starts trended lower in December as inventory levels remained elevated. On an annual basis, Edmonton starts were 12% below 2017 levels, which reflects lower demand driven by the current economic climate in Alberta. Starts for all types of units were lower, except for row units, which grew by 13%.

Regina

December total housing starts trended lower due to a decline in multi-family construction. In 2018, housing starts in the Regina CMA declined by 41% to 1,139 units from 1,923 in 2017. Single-detached starts declined by 47%, while multi-family starts were lower by 37%, compared to the previous year. A weak labour market, tighter credit market conditions, rising construction costs and elevated resale supply - all combined to reduce demand for newly constructed homes.

Kingston

Kingston recorded the highest number of starts in any given month since September 2013. Rental apartments accounted for 77% of total starts in December. These new rental units will contribute needed supply to the market, as the apartment vacancy rate in Kingston has been trending lower since 2016. The total number of housing starts in 2018 was significantly above the 5-year average, with gains for all dwelling types.

Toronto

In 2018, the Toronto CMA saw the most apartment starts ever recorded and overall housing starts were up 6% from a year ago. High prices, borrowing costs, and a widening price gap with resale market alternatives weighed down significantly on single-detached starts, which were the lowest in almost four decades. The deteriorating affordability for low-rise homes has fueled the demand for relatively affordable higher-density housing.

Hamilton

Annual housing starts in Hamilton CMA were the highest since 2004, despite the trend measure moving down in December. Apartment starts were primarily responsible for the high number of overall housing starts in 2018, having reached their highest level in over 40 years. In 2018, more buyers gravitated to less expensive homes and competition for vacant rental units intensified, both of which led to greater demand for new apartments. The appetite for new apartments was widespread across Hamilton CMA in 2018, occurring in each of three major markets, Burlington, Hamilton and Grimsby.

Brantford

A high number of housing starts for December helped annual starts to surpass the 700 mark for just the second time in the past ten years. The price point of new low-rise homes in Brantford attracted more growing families and empty nesters from nearby Hamilton and West GTA markets compared to most years. Single-detached starts rebounded from a slow 2017, while row starts continued to trend up to their highest level since CMHC began tracking starts activity in Brantford over 40 years ago.

Montréal

Housing starts in the Montréal area increased slightly in 2018 compared to 2017 (+1%). The decline recorded in the construction of condos (-6%) during this period was more than offset by rental apartment starts (+8%) which hit a 30-year record high. Just under half of all housing starts in the Montreal CMA in 2018 were intended for the rental market, including starts of rental retirement homes. However, most rental starts were intended for the larger non-retirement home sector. Relatively low vacancy rates, the aging population, and stronger demand from young households were likely all factors that stimulated residential construction in the rental market segment.

Province of Québec

The total number of housing starts in Quebec’s urban areas in 2018 was practically the same as in 2017. Residential construction in the past year continued to be supported by multi-unit housing starts, a large part of which were rental housing units. This was the case notably in Montréal and Québec. Overall, the growth in the supply of apartments in the province was stimulated by the aging of the population and by immigration.

Halifax

Total housing starts in Halifax picked up pace in December due to a rise in apartment construction. By year-end 2018, multiples starts were up 6% compared to 2017 figures, driven by strong rental demand and migration. Apartment construction in 2018 was predominantly located in the suburban markets of Hammonds Plains and Mainland North, as well as on the Halifax Peninsula.

Prince Edward Island (PEI)

Total housing starts in PEI were 156% higher in December compared to a year ago. Singles were up by 9% and multiples by 347%, which contributed directly to the considerable monthly increase. This was driven by new multi-unit apartment and seniors’ condo projects, in reaction to a near zero vacancy rate on the Island. For 2018, total starts were up 26%, driven primarily by strong job growth and positive international immigration throughout the year.


CMHC uses the trend measure as a complement to the monthly SAAR of housing starts to account for considerable swings in monthly estimates and obtain a more complete picture of Canada’s housing market. In some situations analyzing only SAAR data can be misleading, as they are largely driven by the multi-unit segment of the market which can vary significantly from one month to the next.


The standalone monthly SAAR of housing starts for all areas in Canada was 213,419 units in December, down from 224,349 units in November. The SAAR of urban starts decreased by 5.8% in December to 194,594 units. Multiple urban starts decreased by 6.8% to 144,728 units in December while single-detached urban starts decreased by 2.6% to 49,866 units.


Rural starts were estimated at a seasonally adjusted annual rate of 18,825 units.


 Provided by: CMHC

Read

B.C. stats show foreign capital accounted for 2.92 percent of Metro Vancouver residential sales over 11 months
Last August, respondents to an Insights West poll in August identified four "primary causes" affecting the real-estate market.
 

They were, in order of responses, foreign homebuyers (84 percent), population growth (80 percent), shadow flipping (76 percent), and money laundering (73 percent).

But recently released B.C. government statistics suggest that foreign capital is not nearly as significant in the residential market as many might believe.


From January to November of 2018, foreign capital was involved in only 1,438 of the 49,210 transactions in Metro Vancouver.

That's only 2.92 percent of all transactions. The percentage rose to 4.07 percent in November when the market was exceptionally slow. (This information was initially disseminated over Twitter by former Statistics Canada employee Victor Wong.)

The chart below was taken from the DataBC website.

As reported by The Georgia Straight

https://www.straight.com/news/1184966/bc-stats-show-foreign-capital-accounted-292-percent-metro-vancouver-residential-sales

Read

Just Listed: 39 14909 32 Ave., South Surrey, White Rock


Single Level Duplex Style

End Unit with Updates

Price at $774,800

Open House: Jan 12 from 1:30 to 3:30


Click here for more....


Welcome Home! Your search ends here. Ponderosa is a desirable gated complex in sunny South Surrey located close to every type of amenity you can ask for. This fabulous 1401sqft/2bed/2bath single level duplex style end-unit home offers a spacious layout. Features: laminate floors, newer paint & appliances, plenty of storage, over-height ceilings, radiant floor heating, 2 cozy F/Ps, separate dining/living rms & family area off of the spacious kitchen w/breakfast bar & eating area. Enjoy the S/W facing fenced yard w/patio; complete w/power retractable awning. The large master has plenty of closet space & 5pc ensuite. Benefit from dble car garage, well maintained complex w/club house. Act Now! OPEN HOUSE Sat Jan 12 from 1:30 to 3:30pm.
Read

Metro Vancouver home sales decline below historical averages in 2018


Metro Vancouver* home sales in 2018 were the lowest annual total in the region since 2000.


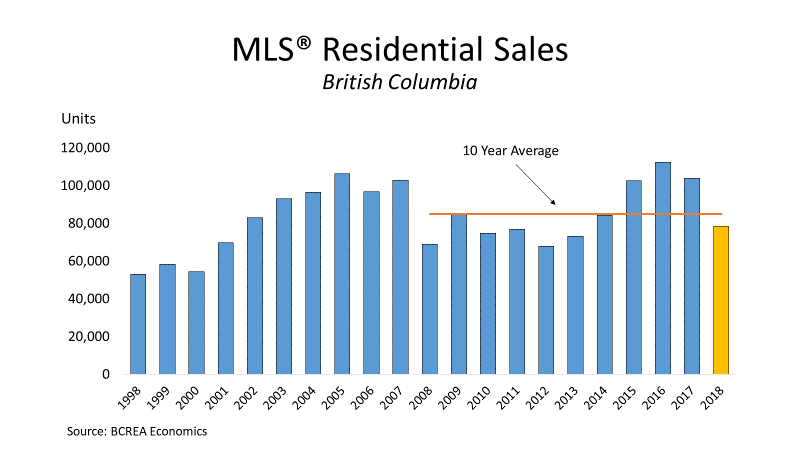
The Real Estate Board of Greater Vancouver (REBGV) reports that sales of detached, attached and apartment properties reached 24,619 on the Multiple Listing Service® (MLS®) in 2018, a 31.6 per cent decrease from the 35,993 sales recorded in 2017, and a 38.4 per cent decrease compared to the 39,943 residential sales in 2016.


Last year’s sales total was 25 per cent below the region’s 10-year sales average.


“This past year has been a transition period for the Metro Vancouver housing market away from the sellers’ market conditions we experienced in previous years,” Phil Moore, REBGV president said. “High home prices, rising interest rates and new mortgage requirements and taxes all contributed to the market conditions we saw in 2018.”


Home listings in Metro Vancouver reached 53,614 in 2018. This is a 1.9 per cent decreasecompared to 54,655 homes listed in 2017 and a 6.9 per cent decrease compared to the 57,596 homes listed in 2016.


“The supply of homes for sale will be an important indicator to follow in 2019. We’ve had record building activity in recent years and many projects will complete soon. This will provide additional housing options for home buyers across the region,” Moore said.


The MLS® HPI composite benchmark price for all residential homes in Metro Vancouver ends the year at $1,032,400. This is a 2.7 per cent decrease compared to December 2017.


“As the total supply of homes for sale began to accumulate in the spring, we began to see downward pressure on prices across all home types throughout the latter half of the year,” Moore said.


The benchmark price of detached homes in the region declined 7.8 per cent over the last 12 months and 7.3 per cent since June 2018. Apartment homes increased 0.6 per cent over the last 12 months and have declined 6.4 per cent since June 2018. The benchmark price for townhomes in Metro Vancouver have increased 1.3 per cent since December 2017 and have decreased 5.3 per cent over the last six months.


December summary
REBGV reports that residential home sales in the region totalled 1,072 in December 2018, a 46.8 per cent decrease from the 2,016 sales recorded in December 2017, and a 33.3 per cent decrease from November 2018 when 1,608 homes sold.


Last month’s sales were 43.3 per cent below the 10-year December sales average.


There were 1,407 detached, attached and apartment homes newly listed for sale on the MLS® in Metro Vancouver in December 2018. This represents a 25.6 per cent decrease compared to the 1,891 homes listed in December 2017 and a 59.3 per cent decrease compared to November 2018 when 3,461 homes were listed.


The total number of homes currently listed for sale on the MLS® system in Metro Vancouver is 10,275, a 47.7 per cent increase compared to December 2017 (6,958) and a 16.5 per cent decrease compared to November 2018 (12,307).


For all property types, the sales-to-active listings ratio for December 2018 is 10.4 per cent. By property type, the ratio is 7.1 per cent for detached homes, 12 per cent for townhomes, and 14.2 per cent for apartments.


Generally, analysts say that downward pressure on home prices occurs when the ratio dips below the 12 per cent mark for a sustained period, while home prices often experience upward pressure when it surpasses 20 per cent over several months.


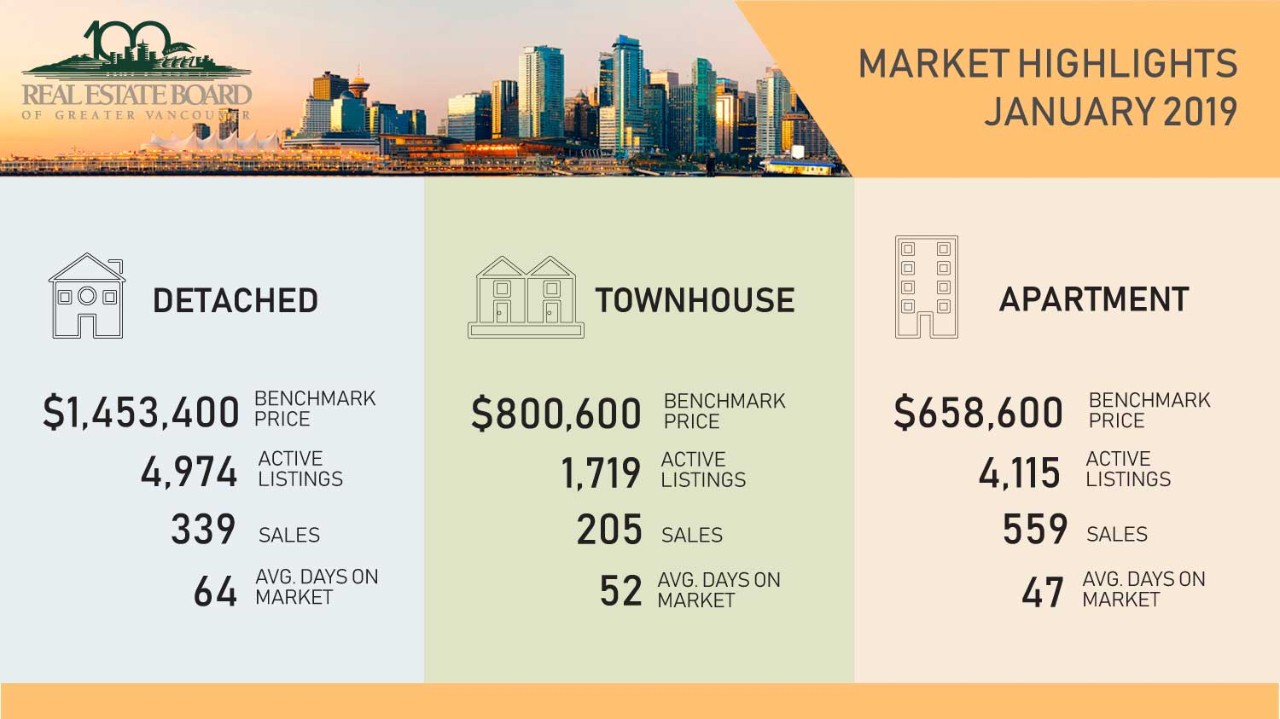
Sales of detached homes in December 2018 reached 348, a 43.6 per cent decrease from the 617 detached sales recorded in December 2017. The benchmark price for a detached home is $1,479,000. This represents a 7.8 per cent decrease from December 2017 and a 1.4 per cent decrease compared to November 2018.


Sales of apartment homes reached 535 in December 2018, a 34 per cent decrease compared to the 1,028 sales in December 2017. The benchmark price of an apartment home is $664,100. This represents a 0.6 per cent increase from December 2017 and a 0.6 per cent decrease compared to November 2018.


Attached home sales in December 2018 totalled 189, a 49.1 per cent decrease compared to the 371 sales in December 2017. The benchmark price of an attached home is $809,700. This represents a 1.3 per cent increase from December 2017 and a 1.1 per cent decrease compared to November 2018.


click here for more...


Provided by: REBGV

Read

A financial services institution is forecasting an ongoing slowdown in British Columbia's housing market, one day after the Canadian Real Estate Association predicted home sales will continue to dip in the province next year.


Central 1 Credit Union, which provides services to more than 300 credit unions across Canada, says in its housing forecast for 2018 to 2021 that B.C. experienced a "mild provincial housing recession" this year.


The report released Tuesday points to the federal government's mortgage stress test, higher interest rates and various provincial policy measures for the downturn and predicts "rising but subdued sales" over the next three years, with little movement in median home prices.


Bryan Yu, Central 1's deputy chief economist, says builders have noted the shift and the result is a sharp drop in housing starts since September, especially in urban areas.


He says starts in B.C. are predicted to fall to about 32,000 units in each of the next two years after nearly 40,000 units were under construction this year and 43,500 in 2017.


But the update also predicts positive housing market outlooks in some areas including Vancouver Island, where retirees fuel the market, and in northern B.C. as demand is boosted by a liquefied natural gas project and associated pipelines.


As work ramps up on the $40 billion LNG Canada project in and around Kitimat, Central 1 says housing markets in the north are forecast to outperform those in southern B.C., which were hit the hardest this year.


"Sales in B.C.'s combined metro markets of Vancouver, Abbotsford-Mission, Kelowna and Victoria are down 40 per cent compared with the end of 2017, led by the Lower Mainland markets," Yu says in a news release.


The report shows annual resale home transactions plunged 17 per cent in 2018 and median resale prices slipped two per cent to $520,000.


"Gone are the days of rapid price escalation," says Yu.


Negative growth in residential investment will drag on the broader B.C. economy, but the Central 1 update says the effect should be blunted by ongoing consumer demand linked to the lowest unemployment rate in Canada, high job vacancy rates, wage gains and population growth.


Provided by: The Canadian Press

Read

Canadian home sales activity softens further in November

Statistics released today by the Canadian Real Estate Association (CREA) show national home sales posted another monthly decline in November 2018.


Highlights:

  • National home sales fell 2.3% from October to November.
  • Actual (not seasonally adjusted) activity was down by 12.6% from one year ago.
  • The number of newly listed homes declined by 3.3% from October to November.
  • The MLS® Home Price Index (HPI) was up 2% year-over-year (y-o-y) in November.
  • The national average sale price retreated by 2.9% y-o-y in November.


Home sales via Canadian MLS® Systems fell by 2.3% in November 2018, adding to the decline in October of 1.7%. While the number of homes trading hands is still up from its low point in the spring, it remains below monthly levels posted from 2014 through 2017. 


Transactions declined in just over half of all local markets, with lower activity in the Greater Toronto Area (GTA), the Greater Vancouver Area (GVA) and Hamilton-Burlington offsetting increased sales in Edmonton.


Actual (not seasonally adjusted) activity was down 12.6% y-o-y and came in below the 10-year average for the month of November. Sales were down from year-ago levels in three-quarters of all local markets, including the Lower Mainland of British Columbia, Calgary, the GTA and Hamilton-Burlington.


“National sales activity has lost a bit of momentum over the past couple of months, but local market trends can be, and very often are, different by comparison,” said CREA President Barb Sukkau. “All real estate is local. A professional REALTOR® remains your best source for information and guidance in negotiating the purchase or sale of a home during these changing times,” added Sukkau.


“The decline in homeownership affordability caused by this year’s new mortgage stress-test remains very much in evidence,” said Gregory Klump, CREA’s Chief Economist. “Despite supportive economic and demographic fundamentals, national home sales have begun trending lower. While national home sales were anticipated to recover in the wake of a large drop in activity earlier this year due to the introduction of the stress-test, the rebound appears to have run its course.”


The number of newly listed homes fell by 3.3% between October and November, with new supply declining in roughly 70% of all local markets.


With new listings having declined by more than sales in November, the national sales-to-new listings ratio tightened slightly to 54.8% compared to 54.2% in October. This measure of market balance has remained close to its long-term average of 53.4% since the beginning of 2018.


Considering the degree and duration to which market balance readings are above or below their long-term averages is the best way of gauging whether local housing market conditions favour buyers or sellers. Market balance measures that are within one standard deviation of their long-term average are generally consistent with balanced market conditions.


Based on a comparison of the sales-to-new listings ratio with the long-term average, about 60% of all local markets were in balanced market territory in November 2018.


The number of months of inventory is another important measure for the balance between sales and the supply of listings. It represents how long it would take to liquidate current inventories at the current rate of sales activity.

There were 5.4 months of inventory on a national basis at the end of November 2018. While this remains in line with its long-term average of 5.3 months, the number of months of inventory is well above its long-term average in the Prairie provinces as well as in Newfoundland & Labrador. By contrast, the measure is well below its long-term average in Ontario, New Brunswick and Prince Edward Island. In other provinces, sales and inventory are more balanced.


The Aggregate Composite MLS® Home Price Index (MLS® HPI) was up 2% y-o-y in November 2018. The increase is similar to gains posted since July. 


Apartment units posted the largest y-o-y price gains in November (+6%), followed by townhouse/row units (+4%). By comparison, one-storey single-family homes posted a modest increase (+0.4%) while two-storey single-family home prices held steady (+0.1%).


Trends continue to vary widely among the 17 housing markets tracked by the MLS® HPI. In British Columbia, home price gains have been steadily diminishing on a y-o-y basis in the Fraser Valley (+4.7%) and Victoria (+7.2%). By contrast, price gains picked up elsewhere on Vancouver Island (+12.6%) and, for the first time in five years, were down (-1.4%) from year-ago levels in the GVA.


Among housing markets tracked by the index in the Greater Golden Horseshoe region, MLS® HPI benchmark home prices were up from year-ago levels in Guelph (+9.3%), the Niagara Region (+7.2%), Hamilton-Burlington (+6.3%), Oakville-Milton (+3.4%) and the GTA (+2.7%). Meanwhile, home prices in Barrie and District remain below year-ago levels (-2.1%).


Across the Prairies, benchmark home prices remained below year-ago levels in Calgary (-2.9%), Edmonton (-1.9%), Regina (-4%) and Saskatoon (-0.3%). Amid elevated supply relative to sales, the home pricing environment will remain weak in these housing markets until they become better balanced.


Home prices rose 6.6% y-o-y in Ottawa (led by a 7.3% increase in two-storey single-family home prices), 6.2% in Greater Montreal (led by a 9.4% increase in townhouse/row unit prices) and 4.2% in Greater Moncton (led by an 11.2% increase in townhouse/row unit prices). 


The MLS® HPI provides the best way to gauge price trends because average price trends are strongly distorted by changes in the mix of sales activity from one month to the next.


The actual (not seasonally adjusted) national average price for homes sold in November 2018 was just over $488,000, down 2.9% from the same month last year.


The national average price is heavily skewed by sales in Greater Vancouver and the GTA, two of Canada’s most active and expensive markets. Excluding these two markets from calculations cuts almost $110,000 from the national average price, trimming it to just over $378,000.


Provided by: CREA

Read

The British Columbia Real Estate Association (BCREA) reports that a total of 5,179 residential unit sales were recorded by the Multiple Listing Service® (MLS®) across the province in November, down 33.1 per cent from the
same month last year. The average MLS® residential price in BC was $718,903, a decline of 1.9 per cent from November 2017. Total sales dollar volume was $3.7 billion, a 34.3 per cent decline from November 2017.


“BC households continue to struggle with the sharp decline in purchasing power caused by the B20 mortgage stress
test,” said Cameron Muir, BCREA Chief Economist. “Most BC regions are now exhibiting relative balance between supply and demand.”


Total active residential listings were up nearly 31 per cent to 33,500 units in November, compared to the same month last year. However, it should be noted that this compares to 2017, when active listings for the month of November were at their lowest level in more than 15 years.


Year-to-date, BC residential sales dollar volume was down 23.1 per cent to $53.4 billion, compared with the same period in 2017. Residential unit sales declined 23.6 per cent to 74,847 units, while the average MLS® residential price was up 0.7 per cent to $713,302.


November 2018 Residential Average Price, Active Listings and Sales-to-Active-Listings Data by Board


Board

Average Price

Active Listings

Sales-to-Active-Listings

November 2018

Residential Average Price

($)

November 2017

Residential Average Price ($)


%

change

November 2018

Residential Active Listings (Units)

November 2017

Residential Active Listings

(Units)


% change

November 2018

Residential Sales to Active

Listings (%)

November 2017

Residential Sales to Active

Listings (%)

BC Northern

295,568

265,040

11.5

1,768

2,005

-11.8

19.5

15.3

Chilliwack

539,600

484,753

11.3

1,272

766

66.1

13.9

37.1

Fraser Valley

746,651

715,364

4.4

6,032

3,891

55

16.2

42.2

Greater Vancouver


1,050,151


1,026,506


2.3


12,978


9,369


38.5


12.6


30.2

Kamloops

405,411

363,762

11.4

967

923

4.8

21.8

24.1

Kootenay

321,861

306,988

4.8

1,519

1,605

-5.4

12.9

16.4

Okanagan Mainline


518,848


501,335


3.5


3,383


2,521


34.2


13.6


24

Powell River

309,089

312,255

-1

98

75

30.7

27.6

26.7

South Okanagan

409,098

446,554

-8.4

1,145

853

34.2

8.6

18.4

Northern Lights

243,162

230,934

5.3

412

376

9.6

8

12

Vancouver Island

462,906

432,410

7.1

2,170

2,007

8.1

25.3

36.5

Victoria

699,452

675,372

3.6

1,764

1,265

39.4

27

49.7

Provincial Totals*


708,903


722,859


-1.9


33,508


25,656


30.6


15.5


30.2

*Numbers may not add due to rounding


November 2018 BC Residential Multiple Listing Service® Data by Board


Board

Dollar Volume (000s)

Units

November 2018 Residential Sales ($)

November 2017 Residential Sales ($)

%

change

November 2018 Residential Sales (Units)

November 2017 Residential Sales (Units)

%

change

BC Northern

101,675

81,102

25.4

344

306

12.4

Chilliwack

95,509

137,670

-30.6

177

284

-37.7

Fraser Valley

729,479

1,173,912

-37.9

977

1,641

-40.5

Greater Vancouver


1,714,896


2,906,038


-41


1,633


2,831


-42.3

Kamloops

85,542

80,755

5.9

211

222

-5

Kootenay

63,085

80,738

-21.9

196

263

-25.5

Okanagan Mainline


238,151


303,307


-21.5


459


605


-24.1

Powell River

8,345

6,245

33.6

27

20

35

South Okanagan

40,092

70,109

-42.8

98

157

-37.6

Northern Lights

8,024

10,392

-22.8

33

45

-26.7

Vancouver Island

253,672

316,957

-20

548

733

-25.2

Victoria

332,939

424,809

-21.6

476

629

-24.3

Provincial Totals*

3,671,410

5,592,034

-34.3

5,179

7,736

-33.1

*Numbers may not add due to rounding

**NOTE: The Northern Lights Real Estate Board (NLREB) became part of the South Okanagan Real Estate Board (SOREB) on May 1, 2011.


provided by: BCREA

Read

HIGHLIGHTS

• Oil prices prompt plunging bond yields

• Canadian economy slowing down

• How high can they go? Is the Bank of Canada already finished with rate increases?


Mortgage Rate Outlook

Midway through 2018, everything seemed to be pointing to sharply higher mortgage rates. The Canadian economy was soaring, the Bank of Canada and its counterpart in the US were resoundingly hawkish and bond yields were testing multi-year highs. However, declining oil prices, the stronger than expected impact of the B20 mortgage stress test and generally soft economic data in recent weeks have prompted a swift change in market sentiment.


Since early November, the 5-year bond yield has dropped close to 50 basis points back to levels last seen in June, prior to two rate hikes by the Bank of Canada. Moreover, expectations for future rate increases have been scaled back even as the Bank itself has reinforced its desire for a 3 per cent policy rate. Slowing economic growth, particularly in light of mandated oil production cuts in Alberta, casts significant doubt on the Bank’s ability to follow through on that desire.


The impact of the mortgage stress test is weighing heavily on traditional lenders’ ability to grow their mortgage books, with growth in residential mortgages at its slowest pace in 17 years. So, even as funding costs were rising earlier this year, banks were hesitant to raise the 5-year qualifying rate.


The 5-year qualifying rate remains at just 5.34 per cent, up a mere 20 basis points on the year. On the other hand, bank lenders are currently pricing 5-year mortgages at 3.74 per cent, up about 40 basis points from the start of 2018. This means borrowers with more than 20 per cent down payments are largely being asked to qualify at 5.74 per cent due to the B20 mortgage stress test. It is unclear if borrowers can bear further mortgage rate increases, with growth in mortgage credit already approaching record lows.


Our forecast over the next year is that a slightly higher policy rate will be pushing against expectations of slower growth in both Canada and the United States. As a result, variable rates may rise modestly with a higher prime rate, while 5-year fixed rates will likely remain relatively flat and may even decline in the first quarter of 2019.


Mortgage Rate Forecast


2018

2019

Term

Q1

Q2

Q3

Q4

Q1F

Q2F

Q3F

Q4F

Prime Rate

3.45

3.45

3.70

3.95

3.95

4.20

4.20

4.20

5-Year Qualifying Rate


5.14


5.27


5.34


5.34


5.34


5.54


5.54


5.54

5-Year Average Discounted Rate


3.39


3.38


3.43


3.74


3.64


3.74


3.74


3.74


Economic Outlook

The most recent quarter of Canadian GDP data was, on the surface, relatively strong, showing that the economy expanded at a 2 per cent annual rate. However, the underlying data was far less encouraging. Household spending slowed, residential investment fell 1.5 per cent and business investment also declined following six consecutive quarterly increases.


One of the more problematic trends to emerge this year is the steep discount on Western Canada Select oil, the primary oil produced in Alberta. A lack of pipeline capacity has prompted a build-up of inventory, causing prices to decline much more than the West Texas Intermediate benchmark price. In turn, Alberta’s economy has struggled with rising unemployment and an uncertain investment climate. In response, the Alberta government has adopted the drastic measure of mandatory cuts to Alberta oil production in hopes of stabilizing prices. Whether that gambit will work is uncertain, though the impact on economic growth due to scaled-back production will be negative in the short run. Early estimates have the scaled-back oil production subtracting over a point of Canadian real GDP growth in the first quarter of 2019.


Interest Rate Outlook

Given the Bank of Canada judges the economy to be at full capacity currently, and inflation is running slightly above its 2 per cent target, its bias remains tilted towards “normalizing” its policy rate back to its estimated neutral level of between 2.5 and 3.5 per cent. With that bias in place, the timing of rate increases, rather than their direction, is the more pertinent issue.


The deep discount for Western Canada Select oil, and the ramifications of limited Alberta oil production, is one reason to be skeptical that the Bank will accomplish its objective to return to a neutral 3 per cent rate over the medium term. However, other cracks in the economy are starting to appear as well, including the highly publicized closing to GM’s Oshawa plant, which will have a material impact on growth in Ontario. Those factors, along with a slowing housing market across Canada and a potentially sharp slowdown in US economic growth next year, may give the Bank pause. For those reasons, our baseline forecast is that the Bank will only be able to bring its overnight rate to 2.5 per cent during this tightening cycle. However, if the disruption in the Alberta oil patch is more prolonged, it may prove very difficult for the Bank to return to a program of rate increases without a lengthy delay. As of now, we expect the Bank will at most be able to raise its policy rate twice next year, though we are leaning toward a single rate hike as the most likely outcome.


Provided by: BCREA


“Copyright British Columbia Real Estate Association. Reprinted with permission.”

Read

Movie Event

Amazing turnout for this year's 12th Annual Client Appreciation event. Private screening of The Grinch.


So grateful for all of your continued support. 

Read

Canadian Housing Starts Trend Increases in November


The natonal trend in housing starts increased in November, following four consecutve months of decline. While single-detached starts contnued to trend lower in November, this was more than ofset by a gain in the trend of mult-unit starts following several months of weakness.


The trend in housing starts was 210,038 units in November 2018, compared to 206,460 units in October 2018, according to Canada Mortgage and Housing Corporaton (CMHC). This trend measure is a six-month moving average of the monthly seasonally adjusted annual rates (SAAR) of housing starts.


Monthly Highlights


Vancouver
Total housing starts in the Vancouver Census Metropolitan Area (CMA) contnued trending lower in November 2018. The majority of November’s starts were concentrated in the cites of Vancouver and Surrey, which together accounted for a third of total starts in the CMA. Year-to-date, total housing starts in the Vancouver CMA have decreased nine per cent compared to the same period in 2017.


Kelowna
The trend measure for housing starts actvity in the Kelowna CMA increased in November due, in large part, to a signifcant increase in mult-unit constructon for the month. In partcular, new apartment condo and rental projects bolstered housing starts in November.


Calgary
The seasonally adjusted annual rate of housing starts in November tcked up in Calgary compared to October largely due to gains in row and apartment units. The underlying trend, however, has been moving lower in the last three months, which can be partally atributed to moderatng employment growth and elevated inventory levels.


Winnipeg
In the Winnipeg CMA, the trend in total housing starts in November increased from the previous month. The upward trend in mult-family starts in November was mainly due to the increase in apartment units, which was enough to off set the decrease in row units.


Toronto
Total housing starts during November trended to its highest level so far in 2018, mainly due to a surge in
condominium apartment starts. The downward trend in single-detached homes persisted in November as a result of fewer new home sales in the year prior. Fewer site openings and high prices have curtailed sales of single-detached homes in recent years.


Oshawa
Total housing starts trended higher as the Oshawa CMA saw the most starts for the month of November in almost three decades. Strong mult-unit starts, partcularly in the City of Oshawa, ofset the decline in the single-detached starts trend. Higher house prices contnue to increase the popularity of relatvely more afordable higher density  housing.


Hamilton
While total housing starts in Hamilton trended down for the second consecutve month in November, they remained at an elevated level due to strength in the row and apartment segments. Row starts are outperforming in Hamilton because they atract buyers that can aford an average priced home. A number of those buyers chose to purchase a new row home rather than a resale single-detached home listed at the same price point, as most single-detached homes in that price range were in need of signifcant updatng.


Windsor
The trend measure of total housing starts contnued its climb to the highest level in 2018. Growth this month came from a jump in apartment starts as well as steady single-detached starts. This year’s rally in housing starts coincided with low supply conditons in the existng home market, leading to additonal demand for new homes.


Québec CMA
From January to November 2018, housing starts in the Québec metropolitan area were down by 25% from the same period in 2017. Residental constructon has been more moderate this year, mainly on account of a slowdown in the condominium segment. The year should end with slightly fewer new rental housing units, even though actvity has remained relatvely signifcant. Supply has been stmulated by certain factors favouring demand for apartments, including migraton and the aging populaton.


Sherbrooke
From January to November 2018, housing starts in the Sherbrooke CMA saw an increase of 15% over the same period in 2017. This strong residental constructon was mainly supported by signifcant growth in the conventonal rental housing segment, which was stmulated by decreases in the vacancy rate in 2017 and 2018. Overall, the rise in full-tme employment and migraton should contnue to support housing demand over the coming months.


New Brunswick
New Brunswick’s total housing starts in November 2018 were 14% higher compared to the same month last year. The increase was due to a 31% rise in mult-unit housing starts while single-detached starts were down 9% compared to November 2017. Mult-unit constructon is being driven by increased demand from recent record immigraton levels and intra-provincial migraton to major centres. A relatvely healthy resale market is also enabling seniors to move from homeownership to rental.


Prince Edward Island (PEI)
Total housing starts in PEI were 93% higher in November compared to a year ago. Singles increased by 17% and multples by 133%, which contributed directly to the signifcant monthly gain. This was the result of new mult-unit apartment projects under development. Year-to-date, total starts are trending 14% higher, driven primarily by solid employment growth.


Click here for more...


Provided by: CMHC

Read

The Bank of Canada today maintained its target for the overnight rate at 1 ¾ per cent. The Bank Rate is correspondingly 2 per cent and the deposit rate is 1 ½ per cent.


The global economic expansion is moderating largely as expected, but signs are emerging that trade conflicts are weighing more heavily on global demand. Recent encouraging developments at the G20 meetings are a reminder that there are upside as well as downside risks around trade policy. Growth in major advanced economies has slowed, although activity in the United States remains above potential.


Oil prices have fallen sharply since the October Monetary Policy Report (MPR), reflecting a combination of geopolitical developments, uncertainty about global growth prospects, and expansion of U.S. shale oil production. Benchmarks for western Canadian oil – both heavy and, more recently, light – have been pulled down even further by transportation constraints and a buildup of inventories. In light of these developments and associated cutbacks in production, activity in Canada’s energy sector will likely be materially weaker than expected.


The Canadian economy as a whole grew in line with the Bank’s projection in the third quarter, although data suggest less momentum going into the fourth quarter. Business investment fell in the third quarter, in large part due to heightened trade uncertainty during the summer. Business investment outside the energy sector is expected to strengthen with the signing of the USMCA, new federal government tax measures, and ongoing capacity constraints. Along with strong foreign demand, this increase in productive capacity should support continued growth in exports.


Household credit and regional housing markets appear to be stabilizing following a significant slowdown in recent quarters. The Bank continues to monitor the impact on both builders and buyers of tighter mortgage rules, regional housing policy changes, and higher interest rates.


Inflation has been evolving as expected and the Bank’s core measures are all tracking 2 per cent, consistent with an economy that has been operating close to its capacity. CPI inflation, at 2.4 per cent in October, is just above target but is expected to ease in coming months by more than the Bank had previously forecast, due to lower gasoline prices. Downward historical revisions by Statistics Canada to GDP, together with recent macroeconomic developments, indicate there may be additional room for non-inflationary growth. The Bank will reassess all of these factors in its new projection for the January MPR.


Weighing all of these developments, Governing Council continues to judge that the policy interest rate will need to rise into a neutral range to achieve the inflation target. The appropriate pace of rate increases will depend on a number of factors. These include the effect of higher interest rates on consumption and housing, and global trade policy developments. The persistence of the oil price shock, the evolution of business investment, and the Bank’s assessment of the economy’s capacity will also factor importantly into our decisions about the future stance of monetary policy.


The next scheduled date for announcing the overnight rate target is January 9, 2019.


Provided by: The Bank of Canada

Read
Reciprocity Logo The data relating to real estate on this website comes in part from the MLS® Reciprocity program of either the Greater Vancouver REALTORS® (GVR), the Fraser Valley Real Estate Board (FVREB) or the Chilliwack and District Real Estate Board (CADREB). Real estate listings held by participating real estate firms are marked with the MLS® logo and detailed information about the listing includes the name of the listing agent. This representation is based in whole or part on data generated by either the GVR, the FVREB or the CADREB which assumes no responsibility for its accuracy. The materials contained on this page may not be reproduced without the express written consent of either the GVR, the FVREB or the CADREB.