RSS

Canadian home sales activity strengthens in July


Statistics released today by The Canadian Real Estate Association (CREA) show national home sales were up from June to July 2018.


Highlights:

  • National home sales rose 1.9% from June to July.
  • Actual (not seasonally adjusted) activity was down 1.3% from July 2017.
  • The number of newly listed homes edged down 1.2% from June to July.
  • The MLS® Home Price Index (HPI) in July was up 2.1% year-over-year (y-o-y).
  • The national average sale price edged up 1% y-o-y.


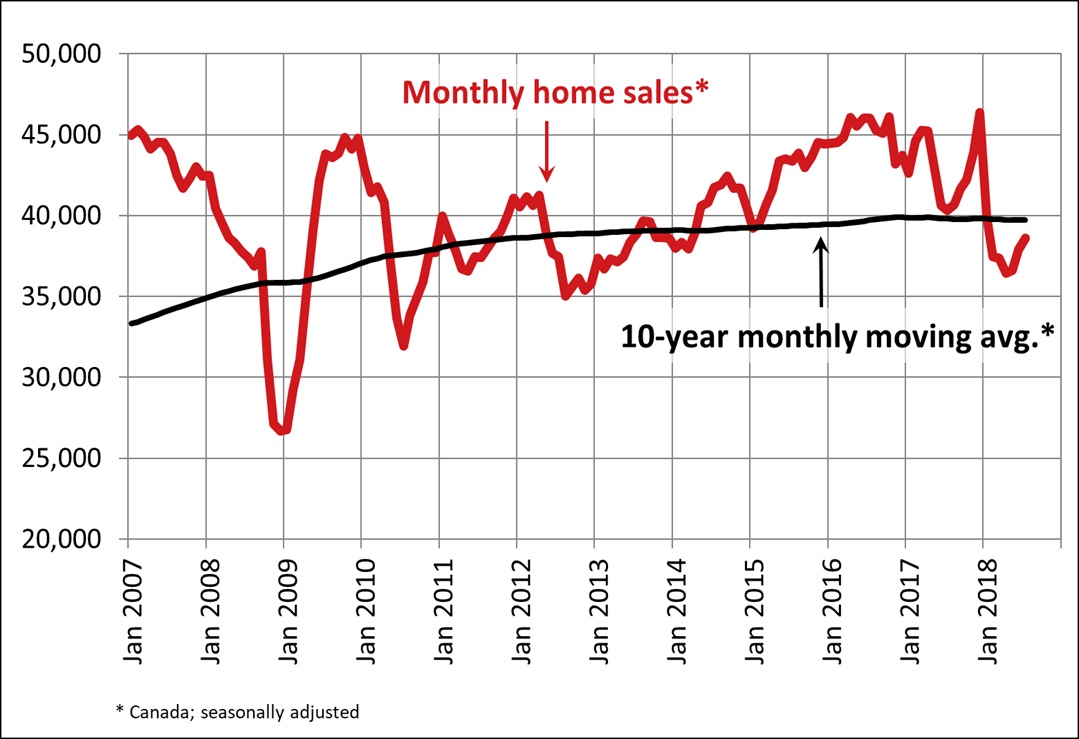
National home sales via Canadian MLS® Systems rose 1.9% in July 2018, building on increases in each of the two previous months but still running below levels recorded from mid-2013 to the end of last year (Chart A). Led by the Greater Toronto Area (GTA), more than half of all local housing markets reported an increase sales activity from June to July.


Actual (not seasonally adjusted) activity was down 1.3% y-o-y. The result reflects fewer sales in major urban centres in British Columbia and an offsetting improvement in activity in the GTA.


“This year’s new stress-test on mortgage applicants continues to weigh on home sales but its effect may be starting to fade slightly in Toronto and nearby markets,” said CREA President Barb Sukkau. “The degree to which the stress-test continues to sideline home buyers varies depending on location, housing type and price range. All real estate is local, and REALTORS® remain your best source for information about sales and listings where you live or might like to in the future,” said Sukkau.


“Improving national home sales activity in recent months obscures significant differences in regional trends for home sales and prices,” said Gregory Klump, CREA’s Chief Economist. “Regardless, rising interest rates and this year’s stress test on mortgage applicants will likely prove to be difficult hurdles to overcome for many would-be first time and move-up homebuyers, heading into the second half of the year and beyond.”

The number of newly listed homes retreated 1.2% in July and stood below monthly levels recorded over most of the past eight years. New listings were down in more than half of all local markets, led by Calgary, Edmonton and Greater Vancouver (GVA). Fewer new listings in these markets more than offset an increase in new supply in the GTA.


With sales up and new listings down, the national sales-to-new listings ratio tightened further to reach 55.9% in July. This reading nonetheless remains within short reach of the long-term average of 53.4% for this measure of market balance.


Considering the degree and duration to which market balance readings are above or below their long-term average is a useful way of gauging whether local housing market conditions favour buyers or sellers. As a rule of thumb, measures of market balance that are within one standard deviation of their long-term average are generally consistent with balanced market conditions.


Based on a comparison of the sales-to-new listings ratio with the long-term average, about two-thirds of all local markets were in balanced market territory in July 2018.


The number of months of inventory is another important measure for the balance between housing supply and demand. It represents how long it would take to liquidate current inventories at the current rate of sales activity.


There were 5.3 months of inventory on a national basis at the end of July 2018, down from 5.4 months in June and near the long-term average of 5.2 months.


The Aggregate Composite MLS® Home Price Index (MLS® HPI) was up 2.1% y-o-y in July 2018. This represents the first acceleration in y-o-y home price growth since April 2017. It also suggests that the dip in home prices last summer and their subsequent rebound in and around the GTA may contribute to further y-o-y gains in the months ahead.


Apartment units posted the largest y-o-y price gains in July (+10.1%), followed by townhouse/row units (+4.7%). By contrast, one-storey and two-storey single family home prices were again down from year-ago levels in July (-0.7% and -1.5% respectively) but the declines were noticeably smaller than in recent months.


Trends continue to vary widely among the 15 housing markets tracked by the MLS® HPI, with home prices up from year-ago levels in eight of them, little changed in two of them and down in the remainder.


Home price gains are diminishing on a y-o-y basis in the Lower Mainland of British Columbia (GVA: +6.7%; Fraser Valley: +13.8%), Victoria (+8.2%) and elsewhere on Vancouver Island (+13.7%).


Among Golden Horseshoe housing markets tracked by the index, home prices remained above year-ago levels in Guelph (+4.1%) and stabilized in Oakville-Milton (+0.1%). By contrast, home prices remained down on a y-o-y basis in the GTA (-0.6%) and Barrie and District (-3%).


In the Prairies, benchmark home prices remained down on a y-o-y basis in Calgary (-1.7%), Edmonton (-1.3%), Regina (-4.8%) and Saskatoon (-2.1%).


Meanwhile, benchmark home prices rose by 7.2% y-o-y in Ottawa (led by an 8.3% increase in two-storey single family home prices), by 5.7% in Greater Montreal (led by a 7% increase in townhouse/row unit prices) and by 5% in Greater Moncton (led by a 9.9% increase in apartment unit prices). (Table 1)


MLS® HPI provides the best way of gauging price trends because average price trends are strongly distorted by changes in the mix of sales activity from one month to the next.


The actual (not seasonally adjusted) national average price for homes sold in July 2018 was just under $481,500, up 1% from the same month last year. This was the first year-over-year increase since January.

The national average price is heavily skewed by sales in the GVA and GTA, two of Canada’s most active and expensive markets. Excluding these two markets from calculations cuts close to $100,000 from the national average price, trimming it to just under $383,000.


Provided by: CREA

Read

Just Listed: 404 2328 Oxford St., Vancouver, Vancouver East

Top Floor, South Facing

Investor Friendly Building

Priced at $458,800


Click here for more info...


BRAND NEW! Well might as well be. The Mariner, located in the heart of Hastings-Sunrise, centrally located to all sorts of amenities with a walk-score of 86, has been completely upgraded: full envelope replacement, roof, windows, balconies, railings, exterior lighting & update plumbing. All under warranty & recently completed. This is a must see. #404 is a top floor, bright south facing 1 bed & den, 1 bath, 609sqft home with an update bath & engineered flooring. Enjoy BBQs from a massive covered balcony. Bonus: 1 parking, hot water baseboard heat, rental & pet friendly. Act Now! Book your private viewing.

Read

Just Listed: 205 9288 University Cr., Simon Fraser University

Lush Forest Backdrop

2 bed & Den Concrete Home

Open House Aug 18 from 1:00 to 3:00

Priced at $634,800


click here for more info...


Beautiful greenbelt views. This 2bed+den/2bath/1097sqft corner unit has a spacious layout; perfect for an owner occupier or the discerning investor. Located in Novo I, UniverCity at SFU; Vancouver's premier lifestyle neighborhood. Features: freshly painted, quality floors, granite counters, SS apps, breakfast bar, lots of windows, covered balcony & cozy F/P. The master has tons of closet space & 3 pc ensuite, the 2nd bed is well sized & the large den w/French doors & windows easily fits a bed. Bonus: rental & pet friendly. Close to: transit, shopping, indoor/outdoor rec & a host of perks available only to UniverCity residents. Don't miss your chance to live in this area and enjoy a great lifestyle. Act Now! OPEN Aug 18 from 1 to 3pm.

Read

Summer Home Sales Slow to a Simmer


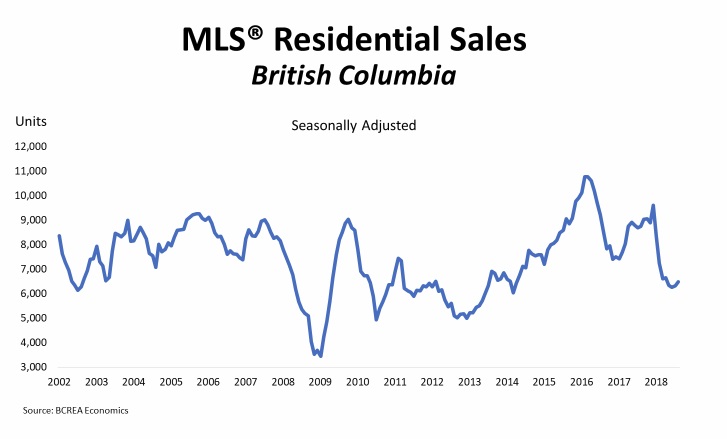
The British Columbia Real Estate Association (BCREA) reports that a total of 7,055 residential unit sales were recorded by the Multiple Listing Service® (MLS®) across the province in July, a 23.9 per cent decrease from the same month last year. The average MLS® residential price in BC was $695,990, down 0.4 per cent from July 2017. Total sales dollar volume was $4.9 billion, a 24.2 per cent decline from July 2017.


“The BC housing market continues to grapple with the sharp decline in affordability caused by tough new mortgage qualification rules,” said Cameron Muir, BCREA Chief Economist. “However, less frenetic housing demand has created more balanced market conditions in many regions, leading to fewer multiple offers and more choice for consumers.”


Year-to-date, BC residential sales dollar volume was down 18.9 per cent to $37 billion, compared with the same period in 2017. Residential unit sales decreased 20.6 per cent to 50,926 units, while the average MLS® residential price was up 2.1 per cent to $725,639.


Click here for more...


Provided by: BCREA

Read

Just Listed: 1008 9266 University Cr., Simon Fraser University

Gorgeous Endless Views

3 bed, 2 bath, 1427sqft

Priced at $974,800

Open: Aug 11 from 2 to 4


click here for more info...


Stunning 270 degrees Mountain & Water views. Gorgeous & rare, SW facing 3bed/2bath/1427sqft home with 223sqft partially covered balcony, won't disappoint. Located in Aurora, of UniverCity at SFU, Vancouver's premier lifestyle neighborhood. Features: functional layout, 9' ceilings, expansive windows, tons of light, large kitchen w/loads of cupboard space, granite counters, gas stove & island w/breakfast bar. The master has walk-in closet & ensuite w/dble sinks & separate shower & soaker. Benefit from the spacious 2nd/3rd bedrms. Bonus: laundry rm, tons of in-suite storage, 2 parking & locker. Close to: transit, shopping, indoor/outdoor rec. & a host of perks available only to UniverCity residents. Act Now! OPEN HOUSE Aug 11 from 2 to 4pm.

Read

Housing supply up, demand down across Metro Vancouver

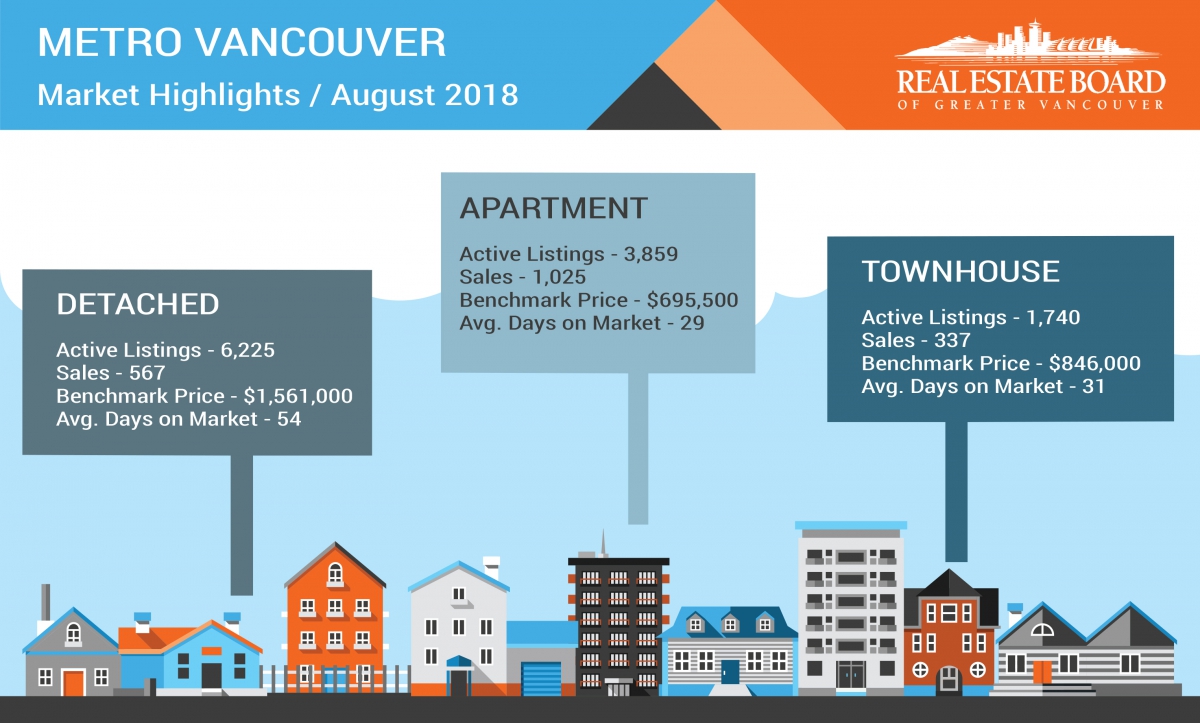
July’s residential housing sales in Metro Vancouver* reached their lowest levels for that month since the year 2000.


The Real Estate Board of Greater Vancouver (REBGV) reports that residential property sales in the region totalled 2,070 in July 2018, a 30.1 per cent decrease from the 2,960 sales recorded in July 2017, and a decrease of 14.6 per cent compared to June 2018 when 2,425 homes sold. Last month’s sales were 29.3 per cent below the 10-year July sales average.


“With fewer buyers active in today’s market, we’re seeing less upward pressure on home prices across the region,” Phil Moore, REBGV president said. “This is most pronounced in the detached home market, but demand in the townhome and apartment markets is also relenting from the more frenetic pace experienced over the last few years.”


There were 4,770 detached, attached and apartment properties newly listed for sale on the Multiple Listing Service® (MLS®) in Metro Vancouver in July 2018. This represents a 9.2 per cent decrease compared to the 5,256 homes listed in July 2017 and a 9.6 per cent decrease compared to June 2018 when 5,279 homes were listed.


The total number of properties currently listed for sale on the MLS® system in Metro Vancouver is 12,137, a 32 per cent increase compared to July 2017 (9,194) and a 1.6 per cent increase compared to June 2018 (11,947).


“Summer is traditionally a quieter time of year in real estate. This is particularly true this year,” Moore said. “With increased mortgage rates and stricter lending requirements, buyers and sellers are opting to take a wait-and-see approach for the time being.”


For all property types, the sales-to-active listings ratio for July 2018 is 17.1 per cent. By property type, the ratio is 9.9 per cent for detached homes, 20.2 per cent for townhomes, and 27.3 per cent for condominiums.


Generally, analysts say that downward pressure on home prices occurs when the ratio dips below the 12 per cent mark for a sustained period, while home prices often experience upward pressure when it surpasses 20 per cent over several months.


The MLS® Home Price Index composite benchmark price for all residential properties in Metro Vancouver is currently $1,087,500. This represents a 6.7 per cent increase over July 2017 and a 0.6 per cent decrease compared to June 2018.


Sales of detached properties in July 2018 reached 637, a decrease of 32.9 per cent from the 949 detached sales recorded in July 2017. The benchmark price for detached properties is $1,588,400. This represents a 1.5 per cent decrease from July 2017 and a 0.6 per cent decrease compared to June 2018.


Sales of apartment properties reached 1,079 in July 2018, a decrease of 26.5 per cent compared to the 1,468 sales in July 2017. The benchmark price of an apartment property is $700,500. This represents a 13.6 per cent increase from July 2017 and a 0.5 per cent decrease compared to June 2018.


Attached property sales in July 2018 totalled 354, a decrease of 34.8 per cent compared to the 543 sales in July 2017. The benchmark price of an attached unit is $856,000. This represents a 12.1 per cent increase from July 2017 and a 0.4 per cent decrease compared to June 2018.


Click here for full stats package....

Provided by: REBGV

Read

Canada Risks Creating 'A Permanent Generation Of Middle-Class Renters': Industry Group

To no one's surprise, Canada's mortgage industry really, really doesn't like federal regulators' new mortgage stress tests. Its principal industry association, Mortgage Professionals Canada, released a report this week on the impact of the tests that is almost apocalyptic in tone.


It blames the stress tests for this year's housing market slowdown, estimating that the reduced real estate activity will mean Canada will create 200,000 fewer jobs over the next three years than it otherwise would have.

About 18 per cent of prospective homebuyers in Canada would fail the stress test on their desired home, the report found, meaning they would have to buy a less expensive home or save up for a larger down payment. On average, these buyers will now be short nearly $29,000 for their purchase, economist Will Dunning estimated in the report.


(He was much more forward in a report last month for his own economic research firm, in which he called the mortgage stress tests "truly stupid" and "unnecessarily and ridiculously dangerous to the economy.")


In the view of many in the industry, the stress tests — which require borrowers to qualify at a rate that's some two percentage points higher than what's being offered on five-year fixed mortgages — are excessive. Mortgage Professionals Canada is suggesting Canada's banking regulator reduce the test to 0.75 percentage points above offered rates.


But the group's report goes further than that. It suggests that the tougher new federal regulations risk creating "a permanent generation of middle-class renters ... as the ability to own homes and generate long-term equity becomes more and more difficult."

"More and more young people are getting used to the idea that they may never own a home and become permanent renters."Mortgage Professionals Canada

What's more, it sees the growing phenomenon of buyers taking money from "the bank of mom and dad" as a bad sign for the future of home ownership.


"This means that there will be 'rationing' in the housing market," Mortgage Professionals said in a press release. "The ability to purchase will be increasingly determined by the buyers' opportunities to get help from parents. The actual circumstances of prospective buyers ... will become less important than the circumstances of their parents."


The report may have a point there. But the mortgage industry is pointing the finger of blame at the wrong target. It's years of eroding affordability, not mortgage stress tests, that created this problem. Long before the stress tests came along, some experts were warning of exactly this.


"Parents will only be able to help if they themselves are wealthy homeowners, so you could have a landed wealth-owning class perpetuating through the generations," author Max Rashbrooke told HuffPost Canada in 2016. "At that point being born into the right family matters a lot."


The single biggest contributor to the problem is house prices rising faster than incomes. The Mortgage Professionals report notes that since 2000, house prices in Canada have tripled on average, growing twice as quickly as incomes. To cover the difference, Canadians have taken on increasingly large amounts of debt, which today sit near record levels.


The point of the mortgage stress tests is to ensure that borrowers can afford to carry that debt, even in a high-interest rate environment. They are designed to reduce the risk to lenders and to homeowners. If they also happen to put a halt to runaway house price growth, that might just solve the housing inequality problem the mortgage industry is so worried about.


Provided by: Daniel Tencer and The Huffington Post

Read

For the eighth consecutive quarter Canada’s overall housing market remains highly vulnerable, primarily due to evidence of overvaluation and price acceleration in Toronto, Vancouver, Victoria, and Hamilton, according to Canada Mortgage and Housing Corporation (CMHC).


On a quarterly basis, CMHC issues its Housing Market Assessment (HMA) to provide Canadians with both expert and impartial insight and analysis, based on the best data available in Canada. This report acts as an “early warning system” for the country’s housing markets — an important tool supporting financial and housing market stability.

Results are based on data as of the end of March 2018 and market intelligence as of the end of June 2018. This national report provides the housing market assessment at the national level and summary assessment results for 15 Census Metropolitan Areas (CMAs). For each of these CMAs, CMHC also issues a local report with more information and analysis.

Key market highlights:

Vancouver

The HMA framework detected moderate evidence of overheating, although price growth has been slowing considerably over the last two quarters, and has turned negative in some areas. Declining prices for detached properties in some areas, particularly Vancouver’s Westside and West Vancouver, are due to high inventories that have accumulated due to sustained falling sales volumes.

Calgary

Evidence of overbuilding remained high in Calgary, but the peak inventory count for apartment units, the largest share of inventory, occurred in December 2017, and has since declined. The absorption rate of condos at completion averaged 83% YTD as of May 2018 compared to 67% in the same period last year, helping to reduce inventory and mitigating the same buildup of inventory experienced in 2017.

Saskatoon

Evidence that the growth of house prices was accelerating remained low in Q1 2018. Among housing categories, the MLS® HPI benchmark prices for single-family, townhouse and apartment units all declined in Q1 2018 from Q4 2017, and were down on a year-over-year basis. Compared with the same quarter the previous year, the price decline during the first quarter of 2018 was significantly larger among townhouses where supply was far exceeding demand.

Regina

Downward pressure on home prices persisted in Q1 2018, contributing to low evidence of price acceleration in Regina. The MLS® HPI benchmark prices for single-detached and townhouse units were $291,300 and $230,900 respectively in the first quarter of 2018, down 2.6% and 2.2% respectively quarter-over-quarter, while apartment unit price was $178,200, up 1.3% quarter-over-quarter. However, prices in all three categories of dwelling types were down on a year-over-year basis.

Winnipeg

Evidence of overvaluation has changed from low to moderate, as the combination of rising house prices and declining incomes have created some imbalances. Real personal disposable income levels have decreased year-over-year for the third consecutive quarter, while mortgage rates have started to increase from historically low levels.

Toronto

Despite price growth slowing down across the Greater Toronto Area, lower house prices would have to persist longer in order for us to discount any evidence of price acceleration. Therefore, the rating from the previous quarter is maintained due to the persistence rule.

Hamilton

While overvaluation decreased on average, moderate evidence of it remained as house prices were still considerably higher than levels supported by some housing demand fundamentals. Population growth remains a key fundamental driver of housing demand in Hamilton.

Montréal

The seasonally adjusted sales-to-new listings ratio was close to 69% in Montreal, in the first quarter of 2018, which is barely below the problematic threshold of 70%. This ratio increased for a seventh straight quarter, as Centris® sales rose more rapidly than new listings. As such, the ratio was closer to the threshold for overheating, and this maintained significant pressure on prices.

Halifax

With 12% growth in year-over-year sales as of the end of May, the sales-to-new listings ratio continues to increase, climbing to 62%. As this remains well below the threshold of 85%, the Halifax market still exhibits low evidence of overheating. The average number of days on market has been on a downward trend throughout 2018 with homes selling more quickly in all Halifax submarkets.

Moncton

Overall, there is a low degree of vulnerability for the Moncton CMA, as the indicators of overbuilding, price acceleration and overvaluation remained below the thresholds that correspond to problematic conditions. However, monthly house sales in Moncton CMA, buoyed by increased immigration and improved labour market conditions, are setting records while listings remain at historical multi-year lows, and still falling. Resale price growth can be expected if demand continues to outpace supply.


Provided by: CMHC

Read

West Coquitlam bucks trend of plummeting Lower Mainland presales

While region's absorption rate takes a nosedive, new home sales in West Coquitlam and Port Moody stay high

The rate at which presale condos and townhomes are being snapped up has plummeted across Greater Vancouver and the Fraser Valley – but West Coquitlam is bucking that trend, according to a July 18 report by a real estate marketing company.


MLA Advisory, the research arm of marketing firm MLA Canada, said in its mid-year report that the absorption rate of newly released presale units in June 2018 across the Lower Mainland was just 50 per cent, compared with 94 per cent in January this year. The monthly absorption rate is the proportion of units that are both released and sold within that month.


Overall, from January to June inclusive, 74 per cent of the 7,753 presale unit released in the Lower Mainland were sold. However, the pace of sales is slowing, with 79 per cent sales in 2018’s first quarter, and 69 per cent in Q2.


But in West Coquitlam, the presale rate was the highest in the entire Lower Mainland, with a January-June sold rate of 96 per cent, out of nearly 718 new homes released. 


Port Moody also saw high absorption rates at 89 per cent of 133 released homes sold in January to June, which was third-highest in the region after Burnaby North.


MLA said the region's overall more modest pace of sales was good news for homebuyers and the industry.


“The current pre-sale landscape is shifting from its once unsustainable, hyperactive growth to a balanced, more normal market,” said Suzana Goncalves, chief advisory officer and partner at MLA Canada. “This is good news for everyone to ensure more modest and realistic price growth, more choice for consumers and the need for higher quality product from the industry. The economic fundamentals including low interest rates, steady employment landscape, and continued demand to move to our sought-after city will allow for a steady shift into a balanced market.”


Local market divergence

Burnaby was not the only local market to defy the region’s overall trend, however. MLA’s report said that Burnaby South and North Surrey also saw strong presale activity, “proving that demand remains high for transit-oriented communities.”


The City of Vancouver, on the other hand, is seeing presales of 61 per cent in East Vancouver projects, 54 per cent for new condo developments on the West Side, and just 34 per cent downtown, according to MLA research.


MLA's report said, "Vancouver proper is seeing a decline in pre-sale absorption as price levels have reached a significant threshold. Some potential buyers in Vancouver are seeking more affordable options with a perceived higher [appreciation]."


The lowest absorption rate was seen in Port Coqutilam, at just 19 per cent of units sold between January and June. Richmond’s rate was also low at 39 per cent.


Investors selling assignments

The anticipation of slower sales and potentially lower prices could be encouraging some pre-sale buyers to sell their sales contracts, known as assignments. A look at listing services Craigslist, Kijiji and Vancouvernewcondos.ca on July 18 found 587 presale condos being offered from West Vancouver and Squamish to Surrey and Langley by both real estate agents and private owners.
 

The February 20 increase in the B.C. foreign-home buyer tax from 15 per cent to 20 per cent could also be a factor in slower pre-sales. Since 2016, the share of new condominiums sold to foreign buyers reached 16 per cent across Metro Vancouver and accounts for about one-quarter of buyers in Richmond and Coquitlam, according to Canada Mortgage and Housing Corp.


Looking to the second half of 2018, MLA is expecting to see 67 project launches with more than 7,700 new homes – around the same amount as in the first six months of the year.


North Vancouver is forecast to be the most active market in the Lower Mainland in the second half, with nearly 1,500 new presale homes expected to be released.


Provided by: Joannah Connolly/ Glacier Media Real Estate for TRi-City News

Photo: Dan Toulgoet

Read

Just Sold: 321 9339 University Cr., Simon Fraser University

Imagine living at SFU walking distance to everything you need. This 705', 1 Bedroom plus Den condo at Harmony by Polygon, is a beautiful, quiet Low-Rise Rain-screened condominium development featuring a central court yard with fountain, surrounded by lush forested walking, hiking & mountain bike trails. Den could be converted into a second bedroom. Gym, meeting facility, Bike Storage, & guest parking. Residents appreciate the many benefits of living at University including access to the University, shopping, cafes, and schools for the little ones. Mountain living close to everything. Includes parking stall located right by the gate. Easy to show!


Click here for more details....


Listing Offered by: ReMax Real Estate Services 

Read

Canadian home sales activity improves in June

Statistics released today by The Canadian Real Estate Association (CREA) show national home sales were up from May to June 2018.


Highlights:

  • National home sales rose 4.1% from May to June.
  • Actual (not seasonally adjusted) activity was down 10.7% from June 2017.
  • The number of newly listed homes eased 1.8% from May to June.
  • The MLS® Home Price Index (HPI) in June was up 0.9% year-over-year (y-o-y).
  • The national average sale price edged down 1.3% y-o-y in June.


National home sales via Canadian MLS® Systems rose 4.1% in June 2018 compared to May. While this marks the first substantive month-over-month increase this year, sales remain well down from monthly levels recorded over the past five years. 


More than 60% of all local housing markets reported increased sales activity in June compared to May, led by the Greater Toronto Area (GTA). By contrast, sales in British Columbia continue to moderate.


Actual (not seasonally adjusted) activity was down almost 11% compared to June 2017. Sales marked a five-year low and stood almost 7% below the 10-year average for the month of June. Activity came in below year-ago levels in about two-thirds of all local markets, led overwhelmingly by those in the Lower Mainland of British Columbia.


“This year’s new stress-test on mortgage applicants has been weighing on homes sales activity; however, the increase in June suggests its impact may be starting to lift,” said CREA President Barb Sukkau. “The extent to which the stress-test continues to sideline home buyers varies by housing market and price range. All real estate is local, and REALTORS® remain your best source for information about sales and listings where you live or might like to in the future,” said Sukkau.


“The national increase in June home sales suggests activity may indeed be starting to turn the corner,” said, Gregory Klump, CREA’s Chief Economist. “Even so, the number of homes trading hands has a long way to go before it returns to levels posted in recent years. Looking ahead, home sales activity and price gains will likely be held in check by higher interest rates.”


The number of newly listed homes retreated 1.8% in June, and also stood below levels for the month in recent years. New listings declined in a number of large urban markets, including those in British Columbia’s Lower Mainland, Calgary, Edmonton, Ottawa and Montreal.


With sales up and new listings down, the national sales-to-new listings ratio tightened to 54.3% in June compared to 51.2% in May. The June reading was within short reach of the long-term average of 53.4%.


Consideration of the degree and duration to which market balance readings are above or below their long-term average is a useful way to gauge whether local housing market conditions favour buyers or sellers. Market balance measures that are within one standard deviation of their long-term average are generally consistent with balanced market conditions.


Based on a comparison of the sales-to-new listings ratio with its long-term average, about two-thirds of all local markets were in balanced market territory in June 2018.


The number of months of inventory is another important measure for the balance between housing supply and demand. It represents how long it would take to liquidate current inventories at the current rate of sales activity.

There were 5.4 months of inventory on a national basis at the end of June 2018, down from the three-year high of 5.6 months in May. The long-term average for the measure is 5.2 months.


The Aggregate Composite MLS® HPI was up 0.9% y-o-y in June 2018, marking the 14th consecutive month of decelerating gains. It was also the smallest increase since September 2009. 


Decelerating y-o-y home price gains have largely reflected trends at play in Greater Golden Horseshoe (GGH) housing markets tracked by the index. Home prices in the region has begun to stabilize and trend higher on a month-over-month basis in recent months.


Apartment units again posted the largest y-o-y price gains in June (+11.3%), followed by townhouse/row units (+4.9%); however, price gains for these homes have decelerated this year. By contrast, one-storey and two-storey single family home prices were again down from year-ago levels in June (-1.8% and -4.1% respectively).


With home prices having climbed above year-ago levels in 8 of the 15 markets tracked by the index, price trends continue to vary among housing markets.


Home price growth is moderating in the Lower Mainland of British Columbia (Greater Vancouver Area: +9.5% y-o-y; Fraser Valley: +18.4%), Victoria (+10.6%) and elsewhere on Vancouver Island (+16.5%).


Within the GGH region, price gains have slowed considerably on a y-o-y basis but remain above year-ago levels in Guelph (+3.5%). By contrast, home prices in the GTA, Oakville-Milton and Barrie were down from where they stood one year earlier (GTA: -4.8%; Oakville-Milton: -2.9%; Barrie and District: -6.5%). The declines reflect rapid price growth recorded one year ago and masks recent month-over-month price gains in these markets.


Calgary and Edmonton benchmark home prices were down slightly on a y-o-y basis (Calgary: -1%; Edmonton: -1.5%), while prices declines in Regina and Saskatoon were comparatively larger (-6.1% and -2.9%, respectively).


Benchmark home prices rose by 7.9% y-o-y in Ottawa (led by a 9.1% increase in two-storey single family home prices), by 6.4% in Greater Montreal (led by a 7.4% increase in townhouse/row unit prices) and by 6% in Greater Moncton (led by a 6.5% increase in one-storey single family home prices). 


The MLS® Home Price Index (MLS® HPI) provides the best way of gauging price trends because average price trends are strongly distorted by changes in the mix of sales activity from one month to the next.


The actual (not seasonally adjusted) national average price for homes sold in June 2018 was just under $496,000, down 1.3% from one year earlier. While this marked the fifth month in a row in which the national average price was down on a y-o-y basis, it was the smallest decline among them.


The national average price is heavily skewed by sales in the Greater Vancouver and GTA, two of Canada’s most active and expensive markets. Excluding these two markets from calculations cuts almost $107,000 from the national average price, trimming it to just over $389,000.


Provided by: CREA

Read
Reciprocity Logo The data relating to real estate on this website comes in part from the MLS® Reciprocity program of either the Greater Vancouver REALTORS® (GVR), the Fraser Valley Real Estate Board (FVREB) or the Chilliwack and District Real Estate Board (CADREB). Real estate listings held by participating real estate firms are marked with the MLS® logo and detailed information about the listing includes the name of the listing agent. This representation is based in whole or part on data generated by either the GVR, the FVREB or the CADREB which assumes no responsibility for its accuracy. The materials contained on this page may not be reproduced without the express written consent of either the GVR, the FVREB or the CADREB.